
CARNEGIE INSTITUTION OF WASHINGTON
Publication No. 395
(Paper No. 36 of Department of Genetics)
1929
RACE CROSSING IN JAMAICA
BY
C. B. DAVENPORT and MORRIS STEGGERDA
in collaboration with
F. G. Benedict, Nutrition Laboratory, Carnegie Institution of Washington
Lawrence H. Snyder, N. C. State College of Agriculture and Engineering
Arnold Gesell, Yale University
Inez Dunkelberger Steggerda, Smith College
and many residents of the colony of Jamaica
Advisory Committee on the Investigation
W. V. Bingham E. L. Thorndike
C. B. Davenport Clark Wissler
The Lord Baltimore Press
Baltimore, MD, U. S. A.
Lanman Engraving Co.
washington, d, c.
Published by
Carnegie Institution of Washington
1929
ABSTRACT
A quantitative study of 3 groups of agricultural Jamaican adults: Blacks, Whites, and hybrids between them; also of several hundred children at all developmental stages. The studies are morphological, physiological, psychological, developmental and eugenical.
The variability of each race and sex in respect to each bodily dimension and many bodily organs is discussed. It appears that mental traits which seem to have a genetic basis vary just as morphological traits do. In some sensory tests the Blacks are superior to Whites; in some intellectual tests the reverse is found. A portion of the hybrids are mentally inferior to the Blacks. The negro child has, apparently, from birth on, different physical proportions than the white child. See also Publications Nos. 188, 236 and 259.
Other books on human heredity published by Carnegie Institution of Washington are Nos. 295 and 296.
CONTENTS
Part I. Introduction
1. History of this investigation
2. The island of Jamaica and the historical development of its population
3. The adult population studied; localities and institutions where measurements were taken
4. Community procedure
5. Individual procedure
6. Method of classifying individuals of adult series
7. Anthropometry:
(1) Weight; (body lengths): (2) stature; (3) suprasternale height; (4) right tragion height; (5) omphalion height; (6) right acromion height; (7) right radiale height; (8) right stylion height; (9) right dactylion height; (10) right iliocristale height; (11) right anterior ilio-spinale height; (12) right tibiale height; (13) right internal malleolus, sphyrion; (14) span; (15) sitting vertex height; (16) sitting suprasternale; (17) kneeling height; (18) kneeling suprasternale height, (arm length, direct measurement) : (19) acromion-stylion length, (trunk breadths) : (20) biacromion breadth; (21) transverse diameter of chest; (22) anteroposterior diameter of chest; (23) bicristal breadth; (24) interspinal breadth; (25) trochanter breadth; (horizontal depths) : (26) of tragion; (27) of glabella; (28) of subnasale; (29) of gnathion; (girths): (30) chest, at rest; (31) umbilical; (32) right upper arm; (33) lower arm, max.; (34) lower arm, min.; (35) thigh, max.; (36) calf; (37) ankle; (38) neck; (head girths) : (39) horizontal; (40) head arch, sagittal; (41) head arch, transverse; (head diameters) : (42) head height; (43) head length, A. P. max.; (44) head breadth, max.; (45) bizygomatic breadth; (46) minimum frontal breadth; (47) bigonial breadth; (facial features) : (48) nose depth; (49) nose salient; (50) nose bridge; (51) ear salient; (52) outer angles of the eye; (53) inner angles of the eye; (54) nose breadth; (55) mouth width; (56) maximum length of right pinna; (57) breadth of pinna; (58) trichion to gnathion; (59) nasion to gnathion; (60) nasion to stomion; (61) nasion to subnasale
8. Physical observations
9. Social data
10. Psychological testing
Part II. Anthropometric findings on adults
Part IV. Psychological tests
1. Musical capacity
2. Form discrimination
Part V. Developmental Studies
A. Methods and materials
6. Description of instruments and measurements
7. Jubilee hospital and the city crèche
B. Results
1. Measurements of growth
2. Indices of growth
3. Growth of children under five years of age
4. Size and shape of heads of new-born negroes
5. Summary of developmental level of 23 colored infants (by Arnold Gesell)
Part VI. Family Studies
6. Two mulattoes
Part VII. General Discussion
1. Variability
[Shortcut version without tables!]
RACE CROSSING IN JAMAICA
By
C. B. Davenport and Morris Steggerda
PART I — INTRODUCTION
1. HISTORY OF THIS INVESTIGATION
In March, 1926, the Carnegie Institution of Washington accepted a gift from a gentleman who expressed his interest in the problem of race crossing, with special reference to its significance for the future of any country containing a mixed population. The work was undertaken by the Department of Genetics, Carnegie Institution of Washington.
The first step was to organize an advisory committee; and the following persons eventually associated themselves as such committee: W. V. Bingham, C. B. Davenport, E. L. Thorndike, Clark Wissler.
As field investigator was selected Mr. Morris Steggerda, a student in the Department of Zoology, University of Illinois, who had already shown marked fitness for the study and analysis of the individual, and had had excellent training in genetics and psychology. Mr. Steggerda was not able to begin work until the middle of June. He then went to the University of Iowa, and had conferences there with Professor Seashore on technical matters. At Chicago he selected some scientific equipment, at Boston he received during two weeks from Dr. F. G. Benedict special training in the technique of measuring basal metabolism, and at New York City he received some special instruction from Professor Pintner of Teacher's College. LetehworthVillage was kindly offered by its Superintendent, Dr. C. S. Little, for training on mental testing and physical measurements.
In September, 1926, Mr. Steggerda, accompanied by Dr. C. B. Davenport, sailed to Jamaica where they were received with every courtesy by the Government officials, who had been informed of the coming of the party by the United States Department of State. The United States Consul, Mr. Jose de Olivarez, introduced the party to Jamaican officials, especially to Mr. D. H. Hall, Second Assistant Colonial Secretary. Through Mr. Hall they were introduced by Dr. B. M. Wilson, Superintending Medical Officer, and Mr. P. J. O'Leary Bradbury, Director of Education. By their cooperation all official doors were thrown open to the research. Mr. Frank Cundall, the distinguished student of Jamaica and head of the Jamaica Institute, gave much valuable assistance on the arrival, and later. To all of these officials they wish to express their sincere gratitude for their cordial cooperation.
Others afforded them great assistance, which they wish to acknowledge with thanks. Dr. B. E. Washburn, Director of the Jamaica Hookworm Commission, supported by the International Health Board of the Rockefeller Foundation, was of especial assistance. Mr. A. J. Newman, Principal of Mico College, greatly facilitated the study of school and college students. During the course of the work, Rev. J. F. Gartshore of Kingston gave valuable aid through various introductions. Miss Ethel Henderson, Director of the City Creche in Kingston, aided in the actual work of measuring and observing. Sydney Rhoden, a sixteen-year-old Brown boy, acted as assistant and recorder. His work was efficient and thorough.
To those who aided materially in the progress of the work acknowledgment will be made under the descriptions of the individual places where measurements were taken.
The plans of work were tried out at MicoCollege and at the Training School. Dr. Davenport then returned to the United States, and Mr. Steggerda continued the work until about December 15, when he returned to ColdSpring Harbor. He met with the committee in New York City, and it was arranged that data should be collected for 50 adults of each sex of the three groups: pure-blooded negro, mulatto and White, of as nearly as possible the same social level. [There are great inherent difficulties in selecting personnel for the three groups that will be strictly comparable, as representing random samples of the respective groups. First of all it was decided that all three groups should belong to the prevailing agricultural class and that the Whites of the governing class and the white merchants of Kingston should be excluded. A difficulty arises in this, that just those Whites who are satisfied to live as agriculturalists in the midst of the island are hardly as representative of the more ambitious and intellectually endowed Whites as the agricultural Blacks are of the run of the Black population. It is possible that in choosing non-urban Whites we have selected farther below of average of Whites than in selecting non-urban negroes we have selected below the average of negroes.] In addition Mr. Steggerda was to secure data for a developmental series of negroes and mulattoes. The tests to be applied were decided upon. Mr. Steggerda then returned to Jamaica early in January, 1927, and returned finally to the United States in October, 1927.
The reports turned in by Mr. Steggerda comprised about 8000 sheets. As received each sheet was given an accession number. These accession numbers will, it is proposed, be permanently maintained in the archives of the Eugenics Record Office at ColdSpring Harbor. They are frequently referred to in the text. An index to the persons named in the reports was also made. The test records were scored as received, chiefly by Miss Bertha Jaeobson. Codes for each of the traits to be tabulated were worked out, adapted to the Hollerith punch cards. Ratios were computed.
After all reports were in, the work of tabulation and computation of constants was undertaken by a group that was under the immediate direction of Miss Catherine Carley, Chief Computer, and Mrs. Irene Grist. Tables and text were edited and typed by Miss Julia Irene Goodrich. The graphs were drawn chiefly by Miss Mae R. Sensing. Especially valuable was-the work of Miss Alice Gould in the final harmonizing of text, tables, graphs and plates. Thanks are due to all of these and to the others who participated in the work of compiling this report.
Finally, we are permitted to record the historical fact that this research was suggested, and rendered possible through a gift made for the research to (and gratefully accepted by) the Carnegie Institution of Washington, by Col. Wickliffe Preston Draper.
2. THE ISLAND OF JAMAICA AND THE HISTORICAL DEVELOPMENT OF ITS POPULATION
The island of Jamaica is one of the Greater Antilles and lies 130 kilometers south of Eastern Cuba and 180 kilometers west of Haiti. It is 230 kilometers long and 80 kilometers broad, and has an area of about 11,000 square kilometers. It is physiographically very rugged, being traversed by a chain of mountains which culminate in BlueMountain peak, 2240 meters high. The mountains are deeply incised by valleys, and in the central and western parts of the island are not a few remarkable depressions, or sinks, all of which have had their influence in determining the distribution and character of the population.
The island first became known to the Eastern world after its discovery by Columbus in May, 1494. At that time it was inhabited by Arawak Indians; peoples that ranged from Brazil to Cuba. In 1509 a colony of Spaniards under Juan d'Esquivel took possession of Jamaica. In the next few years Spanish settlements were made at several points along the coast. First at Seville in the north center (St. Ann) in 1509; then on the southwest coast. SpanishTown, near Kingston, was founded in 1523. The Spaniards brought few Spanish women .with them to these settlements, and much mixture with the Indians occurred. About 1515 the second governor, de Garay, began a system of enslavement of the Indians, which rapidly decimated them and, probably, a large proportion of the hybrids between them and the Spaniards.
The Spaniards at that time included many of Jewish stock, that had wandered with the Arabs, by way of North Africa, to the Iberian Peninsula when it was conquered by the Saracens. In 1608, Portugal having acquired certain interests in Jamaica, a number of Jewish migrated from that country to Jamaica. These, with further immigrations after the British conquest, formed the nucleus of the present numerous Jewish communities (Gardner, 1909, p. 12).
The first appearance of negroes in Jamaica is not precisely known. Negroes accompanied the Spaniards on their voyages of exploration m the early sixteenth century. It is stated by Johnston (1910, p. 38) that the "Apostle to the Indians," Bartolomeo de Las Casas, Bishop of Chiapa in Hispaniola (Haiti), went to Spain in 1517 to protest to the Emperor against the harsh treatment of the feeble Arawaks by the Spaniards, and suggested the importation of hardly West African negroes. It is known that in 1615 a patent was issued to Flemish favorites of the Spanish Emperor to supply 4000 negroes annually to Cuba, Haiti, Jamaica and Porto Rico, and that this patent was passed on to the Portuguese. The first negroes were probably imported into Jamaica in 1517. In one way and another it is estimated by Johnston several thousand negroes were conveyed from Africa to the Greater Antilles during the sixteenth century. Slaves were transported to Jamaica until about 1847, when the slave-trading depots of Africa were destroyed by the British and Americans.
Even "during Spanish rule negro slaves were from time to time escaping into the mountains, casting in their lot with the Arawaks who were hiding there, and breeding with them. Such escaped negroes of the mountains were called Maroons. In 1655 Jamaica was captured by the English, and the Spanish were thereupon wholly expelled. At the same time the greater part of the slaves of the Spanish fled to the mountains and fused with the Maroons, whose designation is still carried by their descendants down to the present time. These mountain negroes caused trouble to white settlers by their depredations; so the English fought them or compelled submission. In 1738 they were granted tracts of land; one 15 miles southeast of Montego Bay; one at AccompongTown and elsewhere in the "cock pit country" (Plate 1, Eig. 1). Later, as a result of nine rebellions among the Maroons (1795), an additional settlement was made at MooreTown in Portland, Eastern Jamaica. It is thus seen that many negroes were more or less segregated in parts of Jamaica 90 to 130 years ago. They have had little contact with the Whites for four or five generations, and constitute a nearly "pure stock" of Negroes.
The African origin of the negroes brought to Jamaica is discussed by Johnston (1910, p. 247). He says: "They were principally derived from the tribes of the Gold Coast — some unusually warlike strain." … "Of the very few African words which survive in the negro dialects and folklore of Jamaica it is certain that the majority are derived from the Chur language of the Ashanti and Fanti." "Anansi," a Jamaican word for spider, is Ashanti. The word for "white man" — "bakara" ("buckra") — is, however, from the Bantu or semi-Bantu languages of the CrossRiver and Western Camaroons. Mr. Gartshore, who was long a missionary in the Ibo country, near Old Calabar, Africa, states that he recognizes several Ibo words in the language of the Jamaican negroes.
The proportion of negro to white in Jamaica has been high from an early date. "In 1673 there were 9504 Negroes in Jamaica (apart from the Maroons) as against 7768 Whites. In 1690 the number of negro slaves had risen to 40,000, while the Whites had decreased to some extent" (Johnston, 1910, pp. 247-248). This great increase was due to extensive importations of negroes to work the sugar plantations. The introduction of coffee into Jamaica in 1721 led to a further introduction of negro labor. By 1764 there were 140,000 slaves in Jamaica; by 1807, 324,000. In 1804, slavery was abolished and compensation paid to owners on 255,290 slaves.
Indian coolies were imported into Jamaica in 1845, and again late in 1868. BytFe last census, the racial composition of Jamaica is as follows.
Whites, 14,476; Colored, 157,223; Blacks, 660,420; East Indian, 18,610; Chinese, 3696; and not stated, 3693. In 1891 there were only 481 Chinese. The number of Whites, absolutely and relatively, is diminishing slightly. In percentages the constitution of the population was, in 1921, as follows: Black, 76.9; Brown (colored), 18.3; White, 1.7; East Indians, Chinese and "not stated," 3.0. The total population of Jamaica by parishes estimated for December 31, 1924, is shown in Table 1 (Cundall, 1926, p. 39).
9. SOCIAL DATA
Information concerning the social life of the individual was obtained by means of a questionnaire. Every measured person answered a series of questions in his own style. His answers were recorded on individual analysis charts by means of checks and words underscored. In order to I obtain the information speedily, it was necessary to make the* questions ; exceedingly simple. A copy of the questions appears below.
Simplified Form of Giving Schedule No. 3 (for social data)
What is your father's name?
Have you ever been sick with typhoid fever or pneumonia?
Do you have malaria very often?
Have you ever had any operations for appendicitis or tonsils, or other?
Do you have any birthmarks, moles or anything like them?
Do you walk fast, slow or moderate? (Underscore the appropriate word.)
What games do you like to play?
How old were you when you stopped going to school? At what book?
What study did you like best of all? Which one did you like next best?
Which one did you hate to do?
Note : The rest of the questions depended largely upon the education of the individual. If he was real bright, he was asked all kinds of questions following the outline. If he was dull and ignorant, he was asked the following:
Do you hate any one? Do you ever faint? Have headaches very often? carpenter work, mason work or machinery? Do you like to teach, preach and make public speeches? Would you like to be a business man or would you rather do the thing you are doing?
Are you very nervous?
Do you worry over many things?
Do you hate any one? Do you ever faint? Have headaches very often? Do you walk in your sleep? Talk in your sleep?
Do you like to live in the town or the country? Do you like to travel?
Where have you been?
Do you smoke? Do you use alcohol?
Do you go to church? Which one?
Now tell me a little about your family.
Thus the outline of a pedigree was obtained.
Mr. Steggerda underlined the parts that applied to the subject, and crossed them out or left them blank if they did not apply. They were asked of every one. On this same schedule 3 were recorded the results of the simple intelligence tests which were given to them.
10. PSYCHOLOGICAL TESTING
a. General Procedure
All of the mental tests were given after the physical measurements and bodily observations were made; thus, ordinarily, the confidence of the individual was gained before the testing began.
The subject was not told the nature of the examination, nor did he' know how many tests were to be given. The tests were taken in the form of little games, generally begun with the Cube Imitation test. Most of the subjects were not aware that any of the tests were in progress, so engrossed had they become in solving the separate little problems.
In that the aim of the study was to compare Blacks, Browns, and Whites under similar environmental conditions, it was thought permissible to vary the procedure of some tests, so that more could be given in the limited time at hand for each person.
Often the procedure of the tests was so varied from the standards employed in the United States that some of the results can not be compared with those obtained in this country; but, since the conditions of the test were uniform for the three groups, the results are comparable. Thus the idea of copying of the square, diamond and circle was taken from different parts of the Binet scale. The free-hand drawing of the man was described by Goodenough, 1926. All these tests were incorporated on one sheet and submitted to the examinee as one test. A certain novelty of technique of this sort applied also to other tests given. However, the procedure used in the tests will be described in detail under their separate heads.
For an accurate comparison of the Blacks, Browns and Whites it was found necessary in some cases to take out the highly selected group of Training College students who comprised chiefly the Brown series, so that the groups would be socially more comparable. These were removed only for the psychological tests, and not for the comparisons of physical measurements. There are sixty-one MicoCollege men, of whom fifteen are Black and forty-six Brown men. The fifteen Black men were left in the series and fifteen Browns selected to remain in the Brown series.
The method of selecting the Brown men to remain in the series was as follows: The first fifteen men measured and the last sixteen measured were removed, leaving the middle fifteen to be compared with the fifteen Blacks. Thus, if the first third were most eager to be measured, and the last third least eager, by choosing the middle third, any selection on the basis of ambition would be eliminated.
A similar method of selection was used in the case of Shortwood TrainingCollege for women. There were four Black girls in the series and thirty Brown girls. The first two and the last two of the thirty Brown girls were allowed to remain to balance the four Black girls.
It may seem unfair to the White series to leave these trained men and women in the Black and Brown series. There is, however, an approximately equal number of persons who live in Kingston, and belong to the more progressive native Whites of Jamaica, who were measured and are listed in the White series.
As far as the tests, applied were concerned, there was no obvious difference between the sexes. Accordingly, all of the intelligence tests were combined under the three main headings: Blacks, Browns and Whites, regardless of sex. Thus the number was increased in each class.
b. Tests op Musical Capacity
The Seashore music tests were designed to test the musical capacity of an individual, by means of phonographic records. The subject has to discriminate between two sounds or sets of sounds, and record his decision on a form. The records are played on an ordinary phonograph. The directions for giving each test are copied, below, from Seashore's "Manual."
Sense of Pitch
"To the listener: You will hear two tones which differ in pitch. You are to judge whether the second is higher or lower than the first. If the second is higher, record H; if lower, record L."
Sense of Intensity
"To the listener: You will hear two tones which differ in loudness or strength. You are to judge whether the second is weaker or stronger than the first. If the second is stronger, record S; if the second is weaker, record W."
Sense of Time
"To the listener: You will hear three clicks marking off two intervals of time. If the second interval (that is, the time between the second and third clicks) is longer than the first interval, record L; if it is shorter, record S."
Sense of Consonance
"To the listener: You will hear two combinations of two tones each; one combination is better or worse than the other in consonance (harmony). A good combination is one in which the two tones are smooth, and blend, tending to fuse together into one. A bad combination is just the opposite. If the second combination is better, record B; if worse, W."
Tonal Memory
"To the listener: In each trial you will hear a series of tones played twice. In the second playing, one note is changed. You are to record, by number, which one was changed. In listening count mentally; for example, 1, 2, in the first playing, and then likewise in the second playing, so that you may identify the one that was changed without error."
Sense of Rhythm
"To the listener: You will hear in rapid succession two rhythmic patterns. If the second is the same as the first, record S; if different, record D."
Procedure in Giving Seashore Test
The following instructions to the examiner were carefully followed in giving the musical tests (Seashore, 1923, p. 9).
"Give specific instructions to the listener as directed for each measure, and explain the method of recording.
"Give preliminary practice, using the Aside of the disc, and allowing the listeners to speak the answers together in competition, until the nature of the test is thoroughly understood. If necessary, play the entire one side of the record, stopping as often as necessary to discuss and explain procedure clearly.
"If the listener can not hear the effect called for, he must guess, as the results are computed on the theory of chance. Require a prompt record for all trials. There is always a difference!"
Tabulation of the Results
Directions for "compilation and interpretation of the results "are given in Seashore's" Manual," and our tables were originally constructed in accordance with them. The resulting distribution of ranks were curiously irregular. Further consideration of Seashore's directions makes it clear that they are poorly adapted to our needs. They are based on the findings with white children of the United States (largely Iowa). Such findings are made the basis of reference from which "ranks" are computed.
After consultation with Professors E. L. Thorndike and R. S. Wood-worth it was decided to tabulate the distribution of per cents right, and to exclude all per cents below 50 per cent, except in the memory test, where no lower limit was arbitrarily assigned. The reason for the exception is that in the case of the memory test alone there are several alternatives to be selected, while in all other cases the judgment rendered is either right or wrong. Were the judgments made at random, 50 per cent of them would, on the average, be right Tabulating the per cents right it soon appeared that the frequencies tend to fall into a unimodal curve (cf. Eig. 124). Presumably even the random guesses, by persons wholly deaf to any distinctions measured by the Seashore tests, would fall into a unimodal curve centered at 50 per cent Actually cases are found at 40-49 per cent, or even lower. These are, of course, omitted in the calculation of the constants of the curves. Also, in each case, the same number is subtracted from the classes that lie at a corresponding distance above 50 per cent. Thus, theoretically, the findings of persons who made only-random choices are eliminated from the final distributions. These remaining distributions are called residual. The constants of the distributions have been calculated from them.
It was found necessary to give the tests on two separate days; e. g., the first three tests on one day and the last three the next day, for the strain becomes too great if all are given in succession.
c. Form Discrimination Test
This test was made with 3 booklets, consisting of 48, 44 and 52 pages, respectively. On each page was an electrotype of two figures. In booklet 1, on each page one figure was a perfect circle, the other departed from a perfect circle — one diameter being more or less shorter than the other that is perpendicular to it. In booklet 2, on each page one figure is an equilateral triangle, the other deviates from equilaterality. In booklet 3, each page carries a pair of octagons, one equilateral and one not.
In grading, the percentage of right judgments was computed and assigned as the examinee's score. Some of the pairs were easy to distinguish between; others exceedingly difficult. Since all were given the same set of forms under the same set of conditions, it is the difference in the results of the tests with the three races that are significant.
The test is one of fine discrimination of differences in form of plane geometric figures.
Field technique — One booklet and one form blank were given to each person with instructions not to open the booklet until so directed. The subjects were asked to look at the right side of the cover page and decide whether that figure was perfect or not perfect. [In the case of triangles and octagons, the word " perfect" was explained to mean with " equal sides."] He was told that one was perfect and the other not, but his decision was to be made concerning the right-hand figure: if it was perfect he was to record "P," if not perfect, "N" on the blank form. This explanation was made absolutely clear. The subjects were told that they would receive ten seconds in which to make and record each decision, and they were not to turn over the page until they were told to do so. Thus the examiner would read the page number at the end of each ten seconds.
d. Form Substitution Test
[Woodworth, R. S., and Wells, F. L.: "Association Tests," Psychological Monographs, vol. xiii, No. 57, 1911, p. 55.]
This test was given individually as well as to groups. The blanks were distributed to each subject with a thorough explanation that he was to place the correct numbers in the figure, using the top line as a key. In concluding the explanation, these words were invariably used: "Thus, whenever you see a circle you put in the number 2. In the square you must put a number 3, and so on. Do just as many as you can, you must not skip any. You will receive one-half minute to study the top line, after that you will receive one and one-half minutes to complete as many as you can.
The number completed was used as one comparison and the number of mistakes as another.
e. Copying Geometric Figures and Drawing a Man
The purpose of this test was to ascertain the ability to copy a figure accurately and to draw another free-handed. This test was taken from various parts of the Binet scale. The subject was handed the form blank and asked to copy the circle just below the printed one. It was explained that he was to make the copy exactly like the original, and was to have one-half minute in which to complete it. In like manner the diamond and square were requested. The subject was then asked to draw a picture of a man in the space directed, and told that at the end of two minutes he was to have it completed. [It was interesting to note that less literate classes went immediately to the task of drawing the man, whereas the more educated people complained of the difficulty of drawing a man.]
Method of scoring — A scale of points was drawn up, including general form, meeting of lines, finish of outline. The scoring was done by Miss Bertha Jacobson. The table of points is as follows:
Method of grading geometric figures
For circles:
Roundness max. score 3
Smoothness of contour max. score 2
Continuity of line max. score 2
Total score 7
For diamonds:
General resemblance 5
Smoothness of contour 3
Union of lines 3
Total score 11
For squares:
Parallelism of sides 5
Smoothness of line 3
Union of lines 3
Total score 11
The following individual tests [Selected from The Binet-Simon Measuring Scale for Intelligence—Revised by H. H. Goddard. 1911.] were given to nearly all of the adult individuals. They were given in the order named above, and selected chiefly because they could be given rapidly.
f. Criticism op Absurd Sentences
These sentences form part of the 11-year-old standard, and the procedure used was practically that described by Goddard (1911).
To the individual: "I am going to read you some sentences in which there is nonsense (foolishness). You listen carefully and see if you can tell me where the nonsense is."
1. An unfortunate man, riding a bicycle, has had his head broken and is dead from the fall; they have taken him to the hospital, and they do not think that he will recover.
2. I have three brothers: Paul, William, and myself.
3. A man said to his friend, "May you live to eat the chickens that scratch sand on your grave."
4. Yesterday there was an accident on the railway. But it was not serious; only 48 people were killed.
5. I received a letter from a friend in which he said, "If you don't get this letter, just let me know and I'll write again."
The individual's answer was recorded on the original record. In scoring the answer, it was either right or wrong. And our results will read the number right out of five. [When in a community for a short time, it was sometimes necessary to select new sentences. None was more difficult than those mentioned.]
g. Repetition of Seven Numbers
To the individual: "I am going to read you seven numbers in a row, and I want you to listen to them and then repeat them after me."
The numbers were: 2, 9, 4, 6, 3, 7, 5 . . . 1, 6, 9, 5, 8, 4, 7 . . . 9, 2, 8, 5, 1, 6, 4.
These numbers were listed in the 12-year-old standard of Goddard's Revision of the Binet Scale. The numbers repeated by the subject were recorded by the assistant. The method of scoring was: if one number in the set was wrong, the entire set was considered wrong. Thus our tables will show the number right out of three sets.
h. Cutting Figure out of Folded Paper
This test was taken from the 15-year-old standard of Goddard's Revision of the Binet Scale. The following directions were used:
Cutting out. Get the child's (person's) attention and let him see you fold a sheet of paper in four. Then with the scissors, cut a small triangle from one edge — the edge which does not open. Ask him to draw a' picture of the paper as it will look when unfolded. Do not unfold the sheet or allow another sheet to be folded by the examinee. This is a difficult test. If a child (person) does it the first time, always ask him if he has seen it done before.
The most common drawing in answer to this problem was one diamond. A "star" and the correct answer, "two diamonds," were drawn in approximately equal numbers. Thus, a code was compiled in which the following values were assigned:
3 — two diamonds 1 — star
2 — one diamond 0 — any other figure
Thus, the higher the answer shown on the tables under results, the better is the score of the group.
i. Ball and Field
This test is found in the 8-year-old standard of the Terman's (1920, p. 15) Revision [This test was one of judgment and planning. It was considered right when the pencil marks showed that the person would walk around the field in a spiral path from center to circumference, or vice versa, toward the center, and wrong if he drew a line merely from one side of field to the other.] of the Binet-Simon intelligence tests.
"Present 'round field' on record blank with gate facing S., and say, 'Let us suppose that your baseball has been lost in this round field. You have no idea what part of the field it is in. You don't know what direction it came from, how it got there, nor with what force it came. All you know is that the ball is lost somewhere in the field. Now, take this pencil and mark out a path to show me how you would hunt for the ball so as to be sure not to miss it. Begin at the gate and show me what path you would take.' If S. stops, say, ' But suppose you have not found it yet, which direction would you go next?'"
This test was applied to so few cases that the results are not tabulated.
j. Manikin Test
Although this test was designed for young children, it was found that many adults failed to complete the figure properly. In this test there are no norms for adults, thus a procedure and method of scoring was devised to meet the circumstances under which the testing was done.
The parts were arranged as shown in Plate 19, Pig. 3, and the person was asked to "Put this together as quickly as you can." Pintner and Patterson (1917, p. 54) direct: "It is to be noted that the leg with the rectangular end is at the opposite side of the body from the place where it fits; in other words, to make a complete performance, the child has to bring the leg and arm at the right over the left side, and the leg and arm at the left over to the right side."
Method of scoring:
1. A complete performance, absolutely accurate. 0 mistakes—grade 4.
2. One arm or leg up or out, i. e., not exactly fitting in the joints. 1 mistake—grade 3.
3. One reversal, i. e., right arm for left arm and vice versa, or right leg for left leg. 2 mistakes—grade 2.
4. One reversal, i. e., both arms and both legs reversed and one arm or leg "up." 3 mistakes—grade 1.
5. Two reversals, i. e., both arms and both legs reversed or arms substituted for legs—all wrong. 4 mistakes—grade 0.
The time necessary for the completion of the performance was recorded and the method of scoring was as follows:
Time (minutes) Grade
2 (or failure) 0
1½ 1
1 2
½ 3
Thus, the higher the grade in the performance of the test, and the lower the time in minutes, the better the individual as far as this test is concerned.
k. Knox Moron Test
This test was designed by Dr. H. A. Knox (1914), and was listed as a ten-year-old test (Plate 19, Fig. 1). The procedure and method of scoring used in this work are as follows:
The blocks were removed from the form board and two placed on either side of it. The board opening (a) was turned toward the individual. The subject was asked to fit the blocks into the cavity of the board as quickly as possible.
The errors which occurred while placing the blocks into the board were not recorded, but only the time taken to complete the performance. As soon as the test was completed the board was emptied and turned so that the broad opening (a) was on the opposite side from that of the first trial. This was done generally quite unobserved by the subject, who was asked to place the blocks again, to see if he could complete the placing in less time than on the first trial. If the first trial was completed by accident or chance, it generally took longer for the second attempt.
Method of Scoring the Knox Moron Test
Minutes 4 3 2 1 Less than 1 minute
Grade 0 1 2 3 4
2nd trial—grade 0 1 2 3 4
Thus, the higher the grade in the test, the less time was required for the performance, or the better the individual as far as this test is concerned.
I. Knox Cube Imitation Test
This test was designed by Dr. H. A. Knox (1914). It consists of a board carrying four colored one-inch cubes (red, blue, green and yellow) fastened four inches apart, and a smaller black block for tapping (Plate 19, Fig. 2).
Method: The board is placed before the subject thus :
Subject
1 2 3 4
Examiner *
[The technique used is slightly different from outlined by Pintner in that the number given to each block is reversed, e. g., 4 reads 1 and 3 reads 2, etc., in his scale, or the positions of subject and examiner were exchanged. This error was not noticed until too many tests were given to warrant a change.]
The method of tapping is as follows:
1.—1, 2, 3, 4 7.—l, 3, 2, 4, 3
2.—1, 2, 3, 4, 3 8.—1, 4, 3, 2, 4
3.—1, 2, 3, 4, 2 9.—1, 3, 1, 2, 4
4.—1, 3, 2, 4 10.—1, 4, 3, 1, 2, 4
5.—1, 4, 3, 2 11.—1, 3, 2, 4, 1, 3
6.—1, 4, 2, 3 12.—1, 4, 2, 3, 4, 1
Opposite to the number of the line is recorded whether the line was done right or not. If one mistake is made in a line, the line is considered as a failure. The examination continued until the individual failed in three successive lines, then the number of the last line passed successfully was used as the score. Thus, in this comparison, the score equals the number of the line previous to three successive failures.
m. Army Alpha Test
This is a mental test for literates as used in the U. S. Army psychological examinations, 1917-1918. Form 8 was employed. This test seemed more appropriate than the Beta Test since the persons examined were able to read. The entire test includes 8 subtests described in detail under the results of the Army Alpha Test (pp. 341-345). The test was applied to groups of persons in a quiet room. The directions as printed in Yoakum and Yerkes' "Army Mental Tests," 1920, were closely followed.
Part IV — psychological tests
It is often held that, while physical differences between races are beyond dispute, it has never been shown that there is such a thing as racial differentiation in mentality. Those who look at matters broadly were inclined, on a priori grounds, to think such difference in mentality and instincts to be probable. Dogs, for example, differ not only in their form, but also in their instincts, such as the mammal-killing instinct of the fox-terrier, the herding instinct of the collie, the instincts of pointing, retrieving, etc.
In humans there has seemed to be a nomadic instinct in gypsies and Bedouins, a trading instinct in Arabs and Jews, an instinct for industry in the Chinese, for tracking in Australian aborigines, for hunting in Indians, and for life on the sea in Norwegians and many English. These differences in behavior have been ascribed by the doubters to tradition, to early training, to opportunity. There has been no satisfactory evidence of innate, constitutional differences.
To test the hypothesis that such constitutional differences in the intellectual and sensory spheres exist, special attention was directed toward psychological tests to be made on our three groups of people from Jamaica.
One series of tests was made on musical capacity, another on form discrimination, and others involving memory, judgment, etc.
1. MUSICAL CAPACITY
The seashore tests for musical capacity were applied to over 90 adults and to about 300 children, belonging to the three racial groups and to both sexes. The results have been tabulated by combining males and females, assuming the equivalence of the capacity in the two sexes. separate tabulations are made of about 150 children of 10 years to just under 13; of about 150 children of 13 to just under 16 years; and of over 90 grown persons. These we tested for pitch, intensity, time, consonance or harmony, memory and rhythm.
In five of the tests 100, or 50, trials were given, and the examinee was required to give a yes or no response. Even a deaf person would by chance, in the long run, by making random answers, get a score of 50 per cent. A number of random answers would group them below and above 50 per cent in the ordinary curve of distribution of errors. Right replies in 49 trials and under mean only chance scores; and probably the same number over 50 per cent are equally chance scores. so the method was adopted of subtracting the number of scores of any class below 50 from the number of scores in the symmetrically corresponding class above 50per cent The remaining scores are probably significant as measures of musical capacity. Means and standard deviations have been determined from these "residual" distributions. They are indicated alongside of the distribution observed.
In one test, namely, that of tonal memory, there is only one correct answer out of three or more possible ones. A score of 50 per cent correct replies is consequently quite definitely significant of capacity. We have drawn the line below which the score no longer signifies capacity at 30 per cent for children and at 40 per cent for adults. This was the best adjustment we could make that was in near agreement with Seashore's "Manual of Instructions," p. 15.
a. Pitch
This test was applied as described at page 34. The percentage of right judgments is shown on Tables 200, 201 and 202 for the three groups, sexes combined.
A study of the distributions for the 10-13-year period shows that the empirical mode is at 65 for the Blacks and 55 for Browns and Whites. The means for the three color groups are respectively: 68.14±1.19, 62.00 ±1.27 and 58.50±1.39. Thus among juveniles, the Blacks show the finest discrimination of pitch; the Whites the least.
Among the adolescents the means stand at 69.82±0.89, 69.59±0.96 and 69.50 + 1.55. There is no statistical significant difference in pitch discriminations in the three groups; what difference there is favors the Blacks. The Browns are most variable.
Comparison of ages — a study of table 203 shows there is a progressive improvement in scores with advancing age. This result suggests that the test measures not only capacity but the ability to use this capacity through past exercise of it. The improvement is greatest in the case of the Browns and least in the case of the Blacks.
Comparison of race — while in the juvenile series the Blacks stand highest in pitch discrimination that superiority is lost, with the improvement in the Browns, in the adult. The Whites are, in general, inferior to the color groups in pitch discrimination.
Variability — as measured by the standard deviation, the Whites are, in general, slightly the most variable, though not significantly more variable than the Browns.
In conclusion, the colored groups are superior to the Whites in pitch discrimination. But even so their best mean "percentage right" is only as high as the mode of 5th-grade children, as found by seashore (1920, p. 27; 1923, p. 11).
b. Intensity
This test of loudness was applied as described at page 34 the percentage of right judgments is shown in tables 204-206, for the three groups, sexes combined.
An examination of Tables 204-206 reveals the fact that the empirical mode of right judgments in the intensity test is, at 10-13 years, at 85 for Blacks, 65 for Browns and 75 for Whites. At 13-16 years the empirical modes range within the same limits; while in the adult series they lie higher, at 85 or 95.
The means, in general, are much higher for intensity than for pitch. At 10-13 years the Blacks got a high mean number right, namely, 75.31±1.17, while Browns and Whites stand at about 71. At 13-16 years the Whites and Browns are ahead at 79-80 per cent right, while among the adults the Blacks scored 86.42±1.10 right, as contrasted with 84.28±0.68 for Browns and 78.00±2.15 for Whites.
Comparison of age — In general (Table 207), the scores in intensity discrimination increase with age, indicating an improvement in ability to discriminate as age advances. This may be due to increased attention.
Seashore (1923, p. 12) finds the same thing among White school children. The means of juvenile Blacks are about the same as Seashore finds for 5th-grade children in Iowa; the Browns and Whites are below the Seashore standard for 5th grade. The adolescents and adults of Jamaica seem to fall below Seashore standards.
Comparison of race — In general (Fig. 122), the Blacks make the best discrimination of intensity and the Whites the worst.
Variability — As measured by the standard deviation, the judgments on intensity are (in general) more variable than those on pitch. There is, in general, a decrease in variability with age. The Browns show generally a variability intermediate between that of Blacks and Whites.
In conclusion, all groups discriminate intensity better than pitch. The Blacks are superior in intensity discrimination to Whites. The Browns show most improvement with age, and are of intermediate variability.
c. Time
This test was applied as described on page 34. The percentage of right judgments is shown in Tables 208-210 for the three groups, sexes combined.
An examination of Tables 208-210 reveals the fact that, in general, the modal percentage of right judgments on time differences is at 65 for the younger groups and at 75 for adults. The means of right judgments for time for adults are about the same as for pitch, respectively: 75.09 ±1.43, 75.27±0.54, 68.79±1.85.
In the juveniles the Blacks apparently make the highest scores and the Whites the lowest; but in the adolescents this order is exactly reversed, just as it is in intensity. It seems probable that the adolescent Whites included more than the run of the musically gifted.
Comparison of age — in general (table 211), mean scores improve with age; the Blacks improve 6 points, Browns 8 points and Whites 7 points from the juvenile to the adult the scores of negroes run about the same as (or slightly better than) seashore's standards (1923, p. 13) ; but the Jamaican Whites are clearly much below those standards.
Comparison of race — on the whole the Blacks are superior in their sense of time, and the Whites the poorest (fig. 123).
Variability — in general, variabilities, as measured by the standard deviation, are low, 6 to 9.5 per cent. The adolescent group is slightly the most variable. The Blacks are, on the average, slightly more variable than the other two groups.
d. Harmony, or Sense of Consonance
The method of applying this test is described at page 34. The distributions and means of right judgments are set forth in tables 212-214 for the three groups, sexes combined.
An examination of tables 212-214 reveals the fact that the empirical mode is generally at 65 per cent. The means are, in general, lower than in the preceding three tests, varying around 65 per cent. The mean scores for the three adult groups are respectively: 66.10±1.06, 67.58±0.54, 67.30 ±1.05. There is no significant difference between these means.
Comparison of age — in general (table 215), the percentage of right judgments increases with age. The mean increases 1.6 points in the Blacks, 3.5 points in the Browns and 4.7 points in the Whites in passing from the juvenile to the adult group. The juveniles do about as well as seashore's standards (1923, p. 14) for the 5th grade; but all Jamaican groups are inferior to seashore's standards for the adolescents and adults.
Comparison of race — there is no clear difference in sense of consonance between our three color groups. The adolescent Whites improve on the juvenile scores more than the Blacks do, but the Whites never gain first place (fig. 124).
Variability — the standard deviations are fairly constant, and are about the same as for time. The adults show slightly the greatest variability. The Blacks are more variable than the Browns.
e. Tonal Memory
This test was applied, as described at page 35. The distributions, means and variability of judgments are set forth in Tables 216-218.
This is the most difficult test, both for the examinee and for the interpreter.
An examination of tables 216-218 reveals the fact that, on account of high variability, there are few well-marked modes: for the juveniles the mode is 25 to 45 per cent; for the adolescents at from 45 to 65 per cent: for the adults 55 or 65 per cent.
The mean score runs small and is the smallest of any test. this is not an indication of an inherent difficulty of the test, but results from the method of grading. the mean score ranges from 47 to 67 per cent the means for the adults of the three color groups are respectively: 64.50±2.31, 63.03±1.02, 66.81±2.09. Here, also, the differences between the groups in tonal memory are not significant (fig. 125).
Comparison of age — in general (table 219), the scores improve with age. the means increase from the juvenile to the adult group 8 points in the Blacks, 13 points in the Browns and 16 points in the Whites; so the Whites show the greatest improvement with age. the scores seem all to be lower than seashore standards (1923, p. 35) for the respective ages. Perhaps sufficient preliminary drill was not given.
Comparison of race — though the differences in mean performance are not striking, still it is probable that the Whites of all ages understood and responded better to this test than the colored groups. This is indeed the only one of the music tests in which the Whites came near to excelling.
Variability — this test is characterized by great variability in the judgments; partly due to method of scoring. variability is greatest in the adolescent group. the Browns are, on the whole, most variable.
f. Rhythm
The test of rhythm was applied as described at page 35. The distributions of right judgments, means and standard deviations are set forth in tables 220-222 and fig. 126.
An examination of tables 220-222 shows that the empirical mode is usually at 75 per cent in the. Younger groups and at 85 per cent in the adults. The mean scores obtained are high, hardly inferior to those obtained in the intensity test. the means range from 67 to 86 per cent in the adult groups the mean scores are respectively: 86.10±1.12, 82.67±0.64, 77.83±1.46. The black score is significantly the highest (fig. 126).
Comparison by age — there is (table 223), on the whole, an increase of per cent of correct discriminations with age. The means increase from the youngest to the oldest group 12 points in the case of the Blacks, 13 points in Browns, and 11 points in Whites. thus the colored groups show the greater improvement.
Comparison of race — on the whole, the Blacks make significantly higher scores in the test for rhythm than the other two groups; and the Whites make the lowest scores. The Blacks clearly have sense of rhythm exceptionally well developed.
Variability — This tends to increase slightly with age. The Blacks and Browns are generally more variable than the Whites.
g. Summary on Musical Capacity
In general (Tables 224, 225), musical capacity, as measured by the Seashore tests, is more highly developed in Blacks than Whites. This superiority is most marked in time, rhythm, intensity and pitch. In sense of consonance the races do not differ significantly. In tonal memory the Whites seem to be slightly superior to the Blacks.
The Browns are generally intermediate between Blacks and Whites in musical discrimination. In two tests applied to the adolescents the Browns have slightly, but not significantly, higher grades than either of the other two groups. In the six adult groups the average of the Browns never significantly exceeds that of the other two groups.
The African Negro thus appears to have at least ordinarily well-developed musical senses. In harmony with this conclusion are the facts of their love of vocal music, their frequent expression of it in religious and other occasions, and the fact that in Africa has been devised a number of simple musical instruments which seems rather large considering the few tools formerly at the disposal of the natives (cf. Deniker, 1926, pp-259-264).
The musical record of the Whites of Seaford Town and Grand Cayman is disappointing. Their worst failure is discrimination of pitch where the mean of the Whites is 14 per cent below that of the Blacks. Also in discrimination of time and in rhythm the Whites are markedly inferior to the Blacks. Evidently northwestern Europe has many biotypes whose musical gifts are far inferior to those of the negroes. The structural elements of the ear or brain upon which the sense of pitch, rhythm and time depend must be, in general, superior in the Blacks and Whites.
h. The West India Band
A special study was made of the musical capacity (Seashore test) of the West India Band. This is a group of musicians, formerly attached to the West India Regiment. The regiment is disbanded, but the group is continued with Government support, as a separate organization. This fills a function in giving evening concerts and rendering music on the occasion of public celebrations.
The outstanding result of Table 226 is the high grade for rhythm shown by all with the exception of Nos. 5 and 23. The Blacks and Browns score much better in rhythm than Whites, but while the former average 80 and 67 per cent respectively in the random sample of population they average 91.2 per cent in the Band population.
A further comparison of the average scores of the Band with that of the run of Blacks examined by us reveals the fact that, in addition to rhythm, the Band surpasses in time. The Band is only mediocre in pitch, harmony and tonal memory. It is actually inferior to the average in musical memory. One may conclude, therefore, for a successful band player a sense of rhythm is first of all necessary, and a sense of time comes second. A sense of intensity, pitch and harmony are less essential.
Of all, the flute player had the highest total score; and one of the cornetists and one of the drummers came second. On the whole, of any group of three or more the cornetists had the highest average score for musical capacity (342), and the horns the lowest (195); but, owing to the small numbers, these results may have no significance.
2. FORM DISCRIMINATION
Over 400 persons were given the Eugenics Record Office group test on form discrimination, consisting of a series of pairs of perfect circles and more or less deformed circles, of pairs of isosceles triangles and slight departures therefrom, and of regular octagons and irregular octagons printed on successive pages of a booklet On each page was one regular and one irregular figure, side by side. The subject was asked to record whether the right hand was perfect "P" or not perfect "N." (See p. 36.)
a. Discrimination of Circles
In this test each person examined a series of 48 sheets on each of which was printed two figures, one a perfect circle and one an ellipsoid figure, more or less approximating to a circle. The examinee recorded his judgment on the problem: Is the right-hand figure perfect or not perfect?, meaning, Is the figure a perfect circle or a deviation therefrom? Ten seconds were devoted to each page. The method of scaring was to compute the per cent of right judgments.
Table 227 gives the frequency distributions of the per cents right, in the discrimination of circles for juveniles, 10-12.9 years of age, sexes combined. The percentages below 50 have no significance, except that 0 scores imply entire lack of understanding of the exercise. Such failures were commonest among the Blacks. On the ground that some of the scores 50-59 and 60-69 may have been random guesses without measuring form discrimination the frequencies in the first, second, etc., classes below 50 per cent (clearly random) were subtracted from the frequencies found at the corresponding frequencies above 50 per cent and the mean and standard deviation computed from the residuum (col. "Res."). This cut down the frequencies, but the treatment seemed fair and even necessary. All tables are treated in this fashion, as described in detail also at page 299.
In Table 227 the classes above 50 per cent are all represented. The empirical modes for all of the three groups are at 70-79. Into the zero class fall 8 per cent of the Blacks and 1.6 per cent of the Browns. The respective means are: 77.95±0.92, 74.30±0.88, 73.89±1.08 per cent. Thus the juvenile Blacks make keenest discrimination of the circles, while the Whites and Browns do about equally poorly. The standard deviations stand at 7.32±0.65, 9.27±0.63 and 9.19±0.76 per cent. Thus the Browns have, perhaps, the greatest variability.
Table 228 gives the results on discrimination of circles by adolescents 13 to 16 years of age. The empirical modes stand at 80-89 for Blacks and 70-79 for Browns and Whites. Two per cent each of Blacks and Browns make complete failures. The mean scores are as follows for the three classes: 79.50±0.70, 78.28±0.62, 77.83±1.12. Here, again, the Blacks give the highest score (though by itself the difference between Black and White would not be regarded as certainly significant). The standard deviations stand at: 6.91±0.50, 9.09±0.44, 10.00±0.79. Thus the Whites and Browns are the most variable; the Blacks (despite their high mean) least.
Table 229 and Fig. 127 give the results on discrimination of circles by adults. The empirical modes stand at about 80-89 per cent. A complete failure was made by 1 Brown. The mean scores for the three classes are as follows: 78.17±1.08, 79.79±0.57 and 82.28+2.32. Thus the adult Blacks and Browns apparently make slightly poorer discriminations of circles than do the Whites; although the number of adult Whites is regrettably small.
Comparison of age and race — There is a slight improvement in discrimination of circles from the juvenile to adolescent stage. The adult shows no further improvement, except, perhaps, the judgments of the adult Whites are probably better than those of the younger Whites.
In general, the Blacks make the best discriminations of distorted circles in their younger years, but they fail to maintain their superiority to adulthood.
b. Discrimination of Triangles
In this test each person examined a series of 52 sheets, on each of which was printed two figures: one an equilateral triangle and one thatdeviated by having one side from about 1 to 15 per cent shorter than the others. the examinee recorded his judgment on the problem: is the right-hand triangle perfectly equilateral or not? Ten seconds were devoted to each page. The method of scoring is as follows: each correct judgment counted 1, then all were reduced to the 100-per-cent basis.
Table 230 gives the frequency distributions of the scores in the discrimination of triangles, for juveniles, 10-12.9 years of age, sexes combined. The empirical mode is at 60-69 for Blacks and at 70-79 for Browns and Whites. About 3 per cent of both Blacks and Browns fall into the zero class. The mean scores are respectively: 68.37±0.73, 73.13±0.92, 70.63±0.91. Thus the Browns' score is significantly better than that of the Blacks or Whites.
The standard deviations of the three groups stand at: 6.05±0.52, 9.7l±0.65, 7.48±0.64. The Browns are most variable in their judgments. There are perfect (or near-perfect) judgments made by the Browns alone.
Table 231 gives the frequency distributions of the scores of adolescents, 13-16 years, on judging triangles. The empirical mode stands at 70-79 for all groups. One complete failure each was recorded for Blacks and Browns. The means for the three groups respectively are: 73.54± 0.67, 73.91 ±0.63, 73.15 ±1.04. There are thus among the adolescents no significant differences in the mean judgments. The standard deviations are: 7.14±0.47, 9.42±0.45, 9.35±0.73. the Browns and Whites are significantly more variable than the Blacks.
Table 232 and Fig. 128 give the frequency distributions of the scores of adults on judging triangles.
The empirical mode for Blacks is at 60-69, and for Browns and Whites at 70-79. The respective means are as follows: 71.38±0.87, 72.52±0.58, 70.21±2.30. There is no obvious difference in triangle discriminations in the three groups. The standard deviations are as follows: 7.26± 0.61, 8.49±0.41, 9.03±1.63. thus there is no significant difference in variability.
Comparison of age and race — In triangle discrimination lower scores were obtained, in general, than in circle discrimination, indicating that the second test was the more difficult The scores improve to adolescence, but the mean score is reduced in the adult. Among the juveniles the Browns score highest, but in judgment on triangles at no later age is there a significant difference between the three color groups.
c. Discrimination of Octagons
In this test each person of a group examined a series of 44 sheets on each of which was printed two figures: one a regular octagon and one an octagon with one or more sides shorter, or longer, than the others. The examinee recorded his judgment on the problem: Is the right-hand figure perfect" or "imperfect"? Each examinee was given a score based on the per cent of right judgments.
Table 233 gives the frequency distributions of the scores in discrimination of octagons for juveniles, 10-12.9 years of age, sexes combined. The empirical mode is at 80-89 for Blacks and Browns, and at 70-79 for Whites. About 2 per cent of each Blacks and Browns fail to score. The mean scores received are respectively: 79.34±1.19, 80.70±0.91, 77.36± 1.11. The probable errors are so high that none of these differences can be regarded as significant; any difference is in favor of the Browns. The standard deviations are: 9.79±0.84, 9.57±0.65, 9.73±0.78. There is no significant difference in variability.
Table 234 gives the frequency distributions of the scores in discrimination of octagons for adolescents, 13-16 years of age, sexes combined.
The empirical mode is at 80-89 for Blacks and Browns, and at 90-100 for Whites. Complete failures were made by 4 per cent of the Blacks and 1 per cent of the Browns. The mean scores are respectively: 81.02±1.00, 85.32±0.57, 85.09±1.19. Thus the adolescent Browns and Whites appear to be significantly better discriminators of triangles than the adolescent Blacks. The standard deviations stand at: 10.47±0.71, 8.29±0.40, 10.27±0.84. The Browns appear to be slightly less variable than the other two groups.
Table 235 and Fig. 129 give the discrimination of octagon scores for adults. Few Whites were tested. The empirical mode stands at 90-100 for all three color groups. The means are as follows: 87.17±0.90, 86.18 ±0.62, 84.5±3.89. The differences can not be said to be statistically significant. The standard deviations are as follows: 7.27±0.63, 9.02±0.44, 14.14±2.76. The Whites and Browns appear to be the most variable.
Comparison of age and race — There is a general age-improvement in scores for discrimination of octagons. However, this improvement is only about 5 per cent, indicating that the test is not too hard, even for the juveniles, to understand. The means, at different ages, can not be said to demonstrate any difference in the race groups in capacity for discriminating octagons.
Taken as a whole the Browns do as well as, if not better than, any other group in the preadult stages. The Whites make always the poorest mean score.
d. Summary on Form Discrimination
The octagons as printed on the test plates were the easiest to discriminate, the triangles most difficult
In discrimination of circles there was improvement from the juveniles to adolescent stage, but not beyond. The Blacks discriminated somewhat better than the Browns or Whites in these youthful stages. Among the adults there is no certain difference, but the Blacks seem to have fallen behind the other color groups.
In discrimination of triangles there was improvement from the juvenile to the adolescent stage, but not beyond. The Browns discriminated somewhat better than the other color groups at all ages; but among the adults the difference is quite uncertain.
In discrimination of octagons there was, on the whole, improvement with age into the adult stage. The Browns showed a slight superiority in the youthful stages, especially at adolescence.
The Blacks and Browns seem, on the whole, better discriminators of slight differences of form than Whites. Probably this is due to better lenses; especially to less astigmatism. The Browns seem to be a little superior to the Blacks in most of the tabulations (except circles), but the differences are not great. About the Whites not much can be said. They showed no superiority in the juvenile and adolescent stages. In the adult the numbers tested are too few to yield a valuable comparison.
It seems a fair conclusion that the colored groups have acuter discrimination of slight differences of form than the Whites, probably because they have better eyes.
3. COPYING GEOMETRIC FIGURES
This test is described at page 37. The quality of the work on each of the three figures was graded carefully on a scale running from 0 up to 100.
The frequency distributions of the scores are given in Tables 236-239 for three age groups and three racial groups. For the young Blacks and Browns the mode is at 50-59; for Whites at 70-79. For adults the empirical modes are at 50-59 for Blacks, 60-69 for Brows, and 70-79 for Whites. Possible real bi- or tri-modality is suggested in the distribution of Blacks, ages 13-16; Browns, ages 10-13, 13-16 and adult; and Whites, 10-13 years and 13-16 years.
The distribution in Table 237 is especially noteworthy. For, in classes below 30 per cent, are found 8 per cent of the Blacks, 16 per cent of the Browns, and 12 per cent of the Whites. Thus, the Browns have the highest percentage of poor draftsmen – much higher than the Blacks or the Whites? Also, the percentage over 80 is 8 per cent among the Blacks, 23 per cent among the Browns, and 28 per cent among the Whites. Thus the Browns have a larger proportion of excellent draftsmen than the Blacks, and almost as large as of the Whites This bimodality of the Browns is seen, though less conspicuously, in the adults of Table 238, also Fig. 130.
Comparisons of age and race — Table 239 shows that with increasing age come fewer failures and higher mean scores in copying the geometric figures. Thus, among the Whites, at 10-13 years, there are 13 per cent of the persons tested who scored less than 10 per cent; at 13-16 this had fallen to 5 per cent and in the adults to 0 per cent. The other race groups show a similar improvement in errors and in mean score. The variability of the results diminishes with increasing age. This speaks for added control of the muscles and probably additional practice in the later years.
The Blacks are characterized by a rather small proportion of lowest grades — smaller than given by Browns and Whites. Their mean score after 13 years is the lowest of all color groups. Browns show many persons who score low after 13 years: a low mode lies at 0-9 score class, just as happens in the other color groups. Whites are remarkable in showing the highest failure rate (classes 0-9) of all color classes at age 10-13. But in the adult, alone of all color groups, there are no cases below score 30, while Browns show 9 per cent and Blacks 7 per cent below that point. The Whites are remarkable in their rapid improvement in drawing with age and in all attaining, by maturity, considerable skill in drawing, while a considerable proportion of the adult Browns, even more than the adult Blacks, fail badly. The mean score of the Whites, all ages considered, is outstandingly superior to the means of Blacks and Browns. This difference can not be accounted for by known difference in formal school training.
Variability, whether measured by the standard deviation or coefficient of variation, is rather uniform in the three groups; but it is, on the whole, highest in the Browns.
In the copying of geometric figures the Whites at all ages, but especially in adulthood, are much superior to the other racial groups and are relatively invariable. The Browns are, in general, intermediate and slightly more variable.
4. DRAWING OF A MAN
As stated at page 37, this was a test of ability to visualize and copy from the mental image a familiar object. The test involves organization of the work, clear imagery, and ability to put through the composition as planned. The results were graded by Miss Jacobson, using the method of Goodenough (1926). The score is built up of points of which a fairly finished drawing (in the two minutes allowed) would hardly secure more than fifty.
The frequency distributions of the scores obtained are shown in Tables 240-242.
Among the juveniles (10-13 years, Table 240 and Fig 131), the empirical modes stand at 5-9 in the Blacks and Browns, and at 10-14 in the Whites. In the Blacks there was only 1 absolute failure (0), but 19 per cent got a very low score of 5 or less. Among the Browns there were 6 failures and 24 per cent got a very low score. Among the Whites there was no complete failure and only 10 per cent scored under 5. The means of the three groups are respectively as follows: 8.15±0.40, 8.12±0.44, 9.98±0.46. Thus the juvenile Whites, by all tests, do better than the other groups in drawing a man.
In the adolescent group (13-16 years of age, Table 241 and Fig. 132), the empirical modes are at 5-9 in the Black group and at 10-14 in the Brown and White groups. All groups show 1 or 2 complete failures. Very low scores (under 5) were obtained by 14 per cent of the Blacks, 11 per cent of the Browns and 11 per cent of the Whites. The respective means are at: 9.68±0.67, 12.08±0.55, 11.32±0.56. Thus the Browns show the highest mean, and this is significantly greater than the mean of the Blacks.
Among the adults (Table 242 and Fig. 133), the empirical modes are at 10-14 for all groups. Complete failure is found in 7 per cent of the Blacks, 8 per cent of the Whites, and 5 per cent of the Browns. The scores under 5 constituted 29 per cent of the scores of the Blacks, 12 per cent of Browns, and 11 per cent of the Whites. The means of the three color groups are respectively: 9.65±0.54, 12.33±0.44, 13.18±0.61. Thus the adult Whites got the best average scores in the drawing of a man. The Whites were significantly better than the Blacks. The standard deviations stand at 7.29±0.38, 7.91±0.31 and 8.35±0.43 respectively. Thus there is little difference in variability in the three groups.
Comparison by age and race — There is an improvement from the juvenile to the adult stages. The Browns show the greatest improvement during this period, and the Blacks least. Variability increases with age and is always greatest among the Browns.
In general, the Whites do best in drawing a man; though their position is at least challenged among the adolescents. The Blacks do most poorly. These results suggest the possibility of a genetic difference between Whites and Blacks in those qualities that are required for successful ^ free-hand drawing without a model.
5. THE RECONSTRUCTION-OF-MANIKIN TEST
The test and its use are described at page 39. The scoring is first on the basis of number of seconds required to put the manikin together; secondly on the basis of mistakes made. Time over ninety seconds is regarded as failure.
The frequency distribution of time taken is given in Table 243 and Fig. 134. The classes range from over 90 seconds (failure) to less than 30 seconds. In all groups all classes are found. The empirical mode is at 60-31 seconds for the Blacks and Browns and at 30-0 seconds for the Whites. The means of the three groups are as follows: 39.41±1.74, 47.14±2.22, 32.82±1.44 seconds. Thus the Whites put the manikin together in by far the shortest time, the Blacks next, and the Browns were a poor third. The Browns took nearly 50 per cent more time, on the average, than the Whites to put the 5 pieces together to make the form of a man. The Browns show 3 to 5 times the proportion of complete failures that the other groups do. The standard deviations of the performances are respectively: 20.66±1.23, 28.04±1.57, 21.03±1.02. Thus the Browns are much the most variable. This suggest the possibility of a genetic difference between negroes and Whites in the capacities required to reconstruct the manikin.
The distribution of mistakes made is shown in table 244 and fig. 135. There were only 5 pieces to put together, so 5 is taken as the greatest number of errors possible. In each color group some persons fell into each class. The empirical mode in each group is at no error. About 30 per cent each of Blacks and Browns make all possible errors, but only 7 per cent of Whites do so. the means of the three groups are respectively: 2.28±0.19, 2.32±0.17, 1.25±0.12. Thus the Whites, on the average, made only about half as many mistakes as the colored groups; and thus they stand in a class by themselves, both in putting the manikin together rapidly and with few errors. Fig. 136 shows clearly the presence in Blacks and Browns of a stupid group and a bright group. The standard deviations of the three groups are at 2.20±0.13, 2.14±0.12 and 1.73±0.08 respectively. The colored groups show a greater variability than the Whites.
6. THE FOLDED AND NOTCHED PAPER TEST
A square of paper is folded once to make a folio and again to make a quarto, the four leaves being one quarter the size of the whole sheet along the edge of the double fold was cut a triangle. The question was asked: when this paper is unfolded what sort of a figure will you see % the scoring is as follows: all wrong, 0; "star," 1; "a diamond," 2; "two diamonds," 3; which latter response is correct relatively few persons answered "star." This is listed as a 15-year-old test.
The frequency distributions of the scores on the folded paper are given in tables 245-248.
The empirical modes at under 13 years are at 2 for Blacks and Browns, and at 0 for Whites. At 13 and over the empirical modes for all groups are at 2; but there is a secondary mode at 0 in both Blacks and Browns. In the adults is nearly an equal number of persons who give no sensible response and who respond a "diamond".
Comparison of age and race — Considering failures, we find that adolescents make fewer than the adult groups. Even the juveniles make very many fewer failures than the adult group. In the case of the Blacks the percentage of failures increases steadily and rapidly from the 10-13-year age group to the adult. In the case of the Browns the increase of failures is also steady, but not so rapid as in the Blacks. In the case of Whites the proportion of failures is greatest at 10-13 and diminishes in later life. The performance at 10-13 years is worse the lighter the skin color. Of Blacks, 7 per cent fail; of Browns, 16 per cent; of Whites, 50 per cent.
Then at adolescence all is reversed; the percentage of failure in the three color groups being 29, 26 and 27. The facts suggest the hypothesis that the Black matures its imagination before 13 years, and thereafter gradually loses this power; while the White child is slower in maturing its imagination, and retains the use of it longer. Also, at its best, during adolescence, the White group makes only a quarter of the failures that the colored groups do.
A study of the distributions of percentages perfect reveals the same thing. None of the Whites make perfect scores up to 16 years, while the colored groups show from 4 to 17 per cent perfect responses. But the White adults show the highest proportion of perfect replies that appears in any part of the table (Fig. 136).
The means show the same thing. The young Whites grade the lowest of all groups; the adult Whites the highest In the colored groups there is a steady decline in idealization of the folded paper problem, accompanying increasing age; in the Whites there is improvement with age.
The Blacks mature early and then deteriorate in their idealization. The Whites are poor at first; improve rapidly and hold their gains. The Browns are intermediate in these respects; but in the adult stage a much smaller proportion of the Browns give perfect responses than of the other groups. In the adult stage the responses of the Browns are inferior to those even of the Blacks.
The variability, as measured by the standard deviation, is low in the youngest group and highest in the adults. The coefficient of variation is less regular, but follows the general rule that holds for the standard deviation. The mature Blacks are most variable; the Whites least.
Summary — The Brows are characterized by precociously high score in the folded paper test; with subsequent failure to improve. The Whites are retarded in the grasping of this problem, but make rapid improvement at adolescence and hold this improvement better than the colored groups.
7. KNOX MORON TEST
This is a simple form board device, standardized in the United States as a ten-year-old test. It is further described at page 40. As here stated, each subject was given two trials, with a slight variation in the "set up." The results are grouped in classes by seconds required to do the te3t Time over 240 seconds is regarded as failure.
First trial — The frequency distributions of the times required for the first trial are given for the three groups in Table 249 and Fig. 137. Some of the times of each of the groups fell into each of the five classes. The Blacks are grouped about two widely separated modes; namely, of good speed and failures. The Whites show only a single mode (at 61-120 seconds). The Browns have some of the characters of both the parental groups. The principal empirical mode lies for all the three groups at 61-120 seconds; the secondary mode being at 241 seconds and over (failure). The means for the three groups are as follows: 118.80±7.20, 112.80±6.00, 87.00±3.60. Thus the Blacks took at least one third longer than the Whites, but actually did relatively worse than that, because there were so many complete failures tabulated (for statistical purposes) as done at 241 seconds. The Browns are intermediate, but are very much nearer the Blacks than the Whites. The standard deviations in the three groups are as follow: 82.20±4.80, 74.40±4.20, 56.40±3.00. Thus the Black appears to be the most variable, because of the large numbers in each of the groups "stupid" and "bright"; giving a bimodal distribution.
Second trial — The frequency distributions of the time required in seconds, to do the test the second time, are given in Table 250 and Fig. 138. The same five classes are represented. Again the Blacks and Browns show two modes, of stupid and bright. This division is less marked, though apparently real, in the Whites also. In the Blacks the frequency in the minimum time class is now over 2.5 times what it was in the first test, and the frequency of the failure class is reduced by nearly 15 per cent In the Browns also the frequency in the minimum class is increased to nearly 2.5 what it was in the first test. The frequency of the failure class is increased 10 per cent. In the Whites the frequency of the minimum time class has not changed. The proportion of failures shows an increase of one person. But the next to the best class has increased 12 per cent (by 8 persons), and the next to the poorest class has disappeared. The Blacks, however, show the greatest improvement.
The means and standard deviations should throw additional light on the racial significance of these differences of distribution. The mean time for the Blacks is reduced from 119 seconds to 105 seconds, while that of Browns is reduced from 113 to 109 seconds. Thus on second trial the Blacks showed much greater improvement than the Browns, and even surpassed them. However, the differences are less than the probable errors. The Whites also showed improvement in time taken, namely from 87 to 80 seconds. This is a greater improvement than was made by the Browns, but not so great as was made by the Blacks. The hypothesis is suggested that the best of the Blacks "caught on" after the first trial, and showed great improvement; and with their natural agility of movement completed the test in minimum time. However, the more stupid Blacks did not show much improvement. With the Whites, on the other hand, while velocity of reaction remained, those who did only mediocre or slow work on the first trial made great improvement on the second trial, eight of them moving out of slower classes into the 61-120 second class. In the Browns there is an increase at the second trial of four in the speediest class, taken largely from the next slower class of the first trial; In general the slowest, most stupid persons showed practically no improvement on the second trial, but the quicker, brighter persons showed much improvement But this improvement was least in Browns. Some of the Browns moved from the two second best classes to the best class, like the Blacks, and moved from the middle class to the second best, like the Whites; but the movement in either case is less than in the respective classes of the parental races.
The standard deviations for the groups are: 85.2±5.40, 81.60±4.80, 55.20 ±2.40. The Blacks remain most variable, the Whites strikingly the least variable. The variability of the Browns is quite like that of the Blacks. On the whole, at the second trial, results are slightly more variable than at the first trial — except in the case of the Whites. This is because the division between the stupid and bright became greater than ever in the second test
General conclusion on Knox moron test — In this test of planning and profiting by experience, the Whites showed themselves clearly superior to the colored groups. This superiority is measured by mean time required for completing the test and also by the relatively small number of persons who were unable to complete the test. There were, indeed, more very speedy individuals in the colored groups, taking less than 1 minute; but the large proportion of Whites completing the test in less than 2 minutes, and relatively few Whites requiring more than 2 minutes, gave to the Whites much the best mean score. It is a consequence of the concentration of the Whites largely in the next to the best class that the variability of their scores is the least of the groups.
8. FORM SUBSTITUTION TEST (WOODWORTH AND WELLS)
This test and the method of applying it are described on page 37. It will be seen that as many as possible of 100 diagrams were to be marked in 90 seconds. The number completed was used as a measure of quickness of reaction.
a. Number Complete
The frequency distribution of number of symbols completed is given m Table 251 and Fig. 139. The numbers range from under 10 to 100.
The empirical modes lie at 30-39 for the Blacks and Browns; at 10-49 for the Whites. The means for the three groups are as follows: 33.30±1.56, 33.46±1.44, 45.60±1.65. This shows that the Blacks and Browns worked with the same speed, and the Whites were nearly 35 per cent speedier. The standard deviation in this test is greatest among the Whites; but the coefficient of variation is least among them. The Whites are relatively the most steadily mediocre performers; while more of the colored persons are sub-mediocre.
b. Number of Mistakes
As Table 252 and Fig. 140 show, the number of mistakes ranged from 0 to 5. The modal number in all groups is 0. No mistakes were made by 67 per cent of the Blacks, 50 per cent of the Browns and 73 per cent of the Whites. The mean number of errors of the three groups is as follows: Blacks 0.55±0.8, Browns 0.90±0.11, Whites 0.40±0.07. Thus, while the Whites are swiftest in their work they make the fewest errors. The Blacks and Browns are alike in speed, but the Browns make, on the average, 75 per cent more errors than the Blacks.
The standard deviation of the number of errors is 0.85 ±0.06 for Blacks, 1.19±0.07 for Browns and 0.85±0.05 for Whites. Thus the Browns are much the most variable, when the size of the mean is not taken into account; least, when it is.
The general impression made in this comparison of the three groups is that the Whites are relatively swift and accurate; the Blacks are slow and accurate; while the Browns are slow and inaccurate.
The Browns are less reliable in the process of carrying and recording their memory of the number associated with each graphic symbol, or forming new associations by repetition. this may be evidence of internal mental disharmonies.
Other racial studies — a substitution test, differing in details from the one we used, has been applied by Baldwin (1913) to 37 white and 30 negro girls at a Pennsylvania reformatory. While the Whites made 72 substitutions, the negroes (colored) made only 56. In this case, also, the Whites did nearly one-third (29 per cent) better than the negroes.
9. KNOX CUBE IMITATION TEST
This test is described on page 41. there are ten subtests in it of varying difficulty. Each that is repeated correctly counts 1.
The frequency distributions of correctly done tests are shown in table 253 and fig. 141. The classes range from 1 to 10. The Browns alone are represented in all of the classes. The empirical mode lies at 6 for all groups. The Blacks seem to fall into two groups, those who can imitate only the simplest two or three sets of movements and those who can do about six. The Browns approach a unimodal variation curve. The Whites are grouped around six and also nine. The means of the three groups are as follows: 4.57±0.17, 5.00±0.16, 6.47±0.16. The Whites clearly do much better than the other groups. The Blacks are poorest and the Browns are intermediate, and nearer to the Blacks than to the Whites, the standard deviations of the groups are as follows: 2.05±0.12, 2.13±0.11, 2.25±0.11. The coefficients of variation run in just the reverse order. The Browns show some evidence of the large befuddled class that we have seen in other tests.
This test of ability to hold in mind a rather complicated series of operations indicates that in this respect the Whites are much superior to either the Blacks or Browns.
10. REPETITION OF SEVEN NUMBERS
The nature of this test is described in detail on page 38. The score indicates the number of tests correct out of three tests given.
The frequency distributions in ability to repeat correctly seven figures are shown in tables 254-257 and fig. 142, for the three age groups and three color groups. In the youngest set the frequencies are small. The empirical mode of the Blacks is at 1; of the Browns at 2; and of the Whites at 0. The latter distribution is that of a half Gaussian curve. In the adolescent set the black mode has risen to 2 and there is bimodality.
The Brown empirical mode is now between 2 and 3; and the distribution is more strikingly bimodal. The mode of the Whites has risen to 1. In the adult series there are two modes at 0 and 3, in all three color groups — complete failures and perfect individuals.
Table 257 shows for each of the color and age groups the percentage failing, percentage perfect, the means and indices of variability.
Comparison of age and race — In passing from 10-13 to 13-16 years the percentage of perfect scores increases in all race groups. This leads to the conclusion that this test measures a mental memory grasp that does not achieve its maximum until adolescence is reached. Adolescents, on the other hand, do better on this test than adults.
The distribution of failures is peculiar in that it is always less at adolescence than before or after. Perfect scores increase regularly with age, but the means fall off in the adult period.
Generally the Browns show the smallest proportion of complete failures. The Blacks and Whites make somewhat similar proportions of perfect scores, but are always inferior to the Browns.
The Browns are the most successful of all racial groups with this memory test of a series of seven figures. A perfect score was obtained by 39 per cent of Browns, as against 30 per cent Whites and 22 per cent Blacks. This result holds for all ages. This extraordinary tenacity and accuracy of verbal memory is an outstanding characteristic of our Browns. The Whites win the booby prize with 56 per cent complete failures, with the repetition of seven figures at 10-13 years. In the adult stage the Whites still show the greatest proportion of errors. But the adolescent Whites show the fewest failures of all groups. In the perfect class Whites show a rapid and steady progress from 10 years to the adult stage; while the Blacks seem to stop improving at 16 years.
Variability, as measured by the standard deviation, is greatest in the Browns. The coefficient of variation seems unsuited to measure variability here; it is erratic in size and distribution.
Summary — The test of ability to repeat correctly seven figures was passed with highest scores by the Browns. The Blacks and Whites are nearly tied. The Blacks develop first and then cease improving, while the Whites tend, on the whole, to improve to and through adulthood. The Browns are the most variable also.
11. CRITICISM OF ABSURD SENTENCES
The nature of this test is described at page 38. Five sentences were given. The answer to each was either right or wrong, and the score was simply the number right.
The frequency distributions of the scores are given in Tables 258-260. In the juvenile group (Table 258), aged 10 to 12.9 years, all three color groups are represented in each category. The scores are very scattered, so that one can not speak of a mode. In Blacks and Browns 2 faint modes, indeed, appear, one at 1 response correct and one at 5 responses correct. The stupid and bright groups are here represented. The two mental types are less obvious among the Whites. The means are respectively: 2.93±0.21, 3.11±0.22, 2.70±0.17. There is no significant difference between the means, though the Brown children appear to do best. The distributions are equally variable.
In the adolescent group (ages 13 to 16 years) the dimorphism of the distributions (Table 259) is still more obvious in the Blacks and Whites than at the earlier age. The performance of the Browns is astonishingly high, for 61 per cent of the persons tested made a perfect score. The mean scores are: Black 3.16±0.23, Brown 4.16±0.13 and White 3.44±0.24.
The superiority of the Browns is outstanding; and this group is the least variable of the three.
In the adult group (Table 260 and Pig. 143) the dimorphism still persists in the Black group, but has disappeared in the others. The empirical modes are at, or near, the perfect end of the series. No longer do the Browns show the striking accumulation of perfect scores. In the White group 47 per cent make a perfect score (Kg. 143). The mean scores are now as follows: 2.91±0.14, 3.29±0.11, 3.82±0.10. The adult Whites are significantly superior to the other two groups. The standard deviation shows no outstanding difference in the three groups.
Comparison of age and race — Table 261 yields some interesting facts. There is a certain, but irregular, improvement in the mean score with age. The percentage of complete, or nearly complete, failures tends to decrease and the perfect scores to increase with ago. More striking is the fact that, on the whole, the colored adolescents do best of any ago group. They stop improvement at about 10 years, while the Whites continue to improve. Thus the adult Whites show only 2 per cent of complete failures, only 8 per cent of low scores (0 to 1 only correct) ; and the percentage of perfect Whites has increased from juvenile 18, through adolescent 35 to adult 47, while the per cent of perfect Browns has fallen from 61 per cent to adult 27 per cent. In mean score the colored groups reach their zenith at 13 to 16 years, while the Whites keep right on improving to the adult state. This precocity of the Browns and their failure to continue to progress has been noticed elsewhere in this study.
It is hard to compare the three race groups without taking age into account Certainly, among adults, the Whites are outstandingly superior in their ability to see through absurd statements.
Variability — There is not much difference in the standard deviation of the three color groups at the different ages, except that it is low in adolescent Browns and adult Whites where the means are high. This difference is naturally exaggerated in the coefficient of variation.
12. ARMY ALPHA TEST
The Army Alpha test was given, in accordance with directions, as indicated in the Introduction (p. 42).
The findings for each of the eight tests are given separately.
a. Test I
This is a series of directions of things to be done (or not done) on certain contingencies. For example: "Notice the 3 circles and the 3 words. When I say 'go!' make on the first circle the last letter of the first word, in the second circle the middle letter of the second word, and in the third circle the first letter of the third word. Go!" (Allow not over 10 seconds.) (Yoakum, C. S., and K. M. Terkes, 1920, p. 60.) This would seem to be a test of attention, memory, accuracy.
The distribution of frequency of number of correct replies to the 12 subtests are given in Table 262 for different ages and for each racial group — sexes combined.
It appears that at 10-12.9 years only one person — a white child — could do over half of the operations correctly. The Blacks were distinctly poorest; the Browns and Whites about equally good. At 13-15.9 years there is a distinctly better reaction. The Blacks are slightly the poorest. The Browns and Whites do about equally well on the average. Among the adults the Blacks are probably slightly the best; the Whites and the Browns are somewhat poorer. Apparently the adult Blacks are the most reliable in attention, memory and accuracy; but are retarded in reaching this superiority. In two of the three age groups the Browns are the most variable.
b. Test II
This is a test of insight into various (37) numerical problems. Some are easy, such as: "How many are 60 guns and 5 guns?" It would seem as though any normal child of 10 years could answer that. Others are much more complicated, such as: "A U-boat makes 8 miles an hour under water and 20 miles on the surface. How long will it take to cross a 100-mile channel, if it has to go two-fifths of the way under water? "
The directions given allow 5 minutes. "Do as many as you can."
As shown in Table 263, at 10-12.9 years, the Black children did most poorly; the Browns and Whites are about equal. No Brown children failed to answer at least 2 questions, while 4 (a third) of the White children did. But while only 1 out of 16 of the Browns did more than 5 questions, a quarter of the Whites did.
At 13-15.9 years the Blacks and Whites did equally poorly and the Browns best; but the difference is not really significant. In the adult series the Blacks got the highest average grade and the Whites the lowest.
The conclusion is that in simple arithmetical problems the Browns do best in the preadult years, and the Blacks best in two out of three series. In two out of three groups the Browns are the most variable.
c. Test III
This is a series of practical judgments — "a test of common sense." A threefold choice is offered. For example, "The main thing the farmers do is to
- supply luxuries
- make work for the unemployed
- feed the nation."
Mark the best answer with a cross. 1½ minutes allowed for the 16 problems in this test.
As shown in Table 264, in the 10-12.9-year-old period only 1 Black child and 1 White got over half of the 16 problems right There is very little difference in mean values of replies. In the 13-15.9-year-old period no black, 1 "white and 5 Browns gave over one half of the problems correctly. the Browns got the highest score.
Of the adults the Whites get a score of 8.5, the Blacks of 5.9, the Browns of 5.2. The Browns have the most failures, by all odds, but they got more high scores than the Blacks.
We may conclude that of all groups the adult Whites, in this test, show the most "common sense."
d. Test IV
This is a test of the use and meaning of word. The subjects were to state in the case of 40 pairs of words whether they had the same or opposite meaning, e. g., begin — commence, ancient — modern.
As shown in table 265, of the 10-12.9-year olds most failed entirely; the Whites as badly as any. The best showing was made by the Browns, and they secured the highest average grade and were most variable.
Of the 13-15.9-year olds the Whites and Browns did about equally well; and the Browns were most variable.
Of the adults the Whites did by far the best; the Browns were clearly the poorest; 2% times as many in the lowest grade as of the Blacks, but also 1 better than any black.
we may conclude that the adult Whites have the best appreciation of what is meant by same and opposite, and can recognize them most accurately. The adult Browns showed a large number of extraordinarily stupid persons.
e. Test V
This consists of 24 disarranged sentences, e. g., "moon earth the only from feet twenty the is." the examinee is to state whether the properly arranged sentence is true or false.
None of the 10-13-year olds (table 266) did half of these sentences right, and only 10 per cent of the 13-16-year olds. At these ages the Browns averaged best. Of the adults the Whites showed the best average — 11.4 right, as opposed to 8.8 of the Blacks and 6.4 of the Browns.
The adult Whites show the best insight into the proper arrangement of the disarranged sentences and judgment in concluding as to their falsity. An exceptionally large number of the adult Browns failed completely.
f. Test VI
Completion of a number series — a series of numbers, like 2, 4, 6, 8, 10, 12, was given and the subject was told to add two additional members to the series (in this case, obviously 14, 16). He was given 20 of these series, some much more difficult, e. g., 81, 27, 9, 3, 1, 1/3; or, 16, 17, 15, 18, 14, 19. This tested an ability to see a rhythm in a series and some insight into numerical relations. Three minutes were devoted to the 20 series.
Of children 10-12.9 years (table 267) practically none got half right; half the Blacks and Browns failed completely. The Whites did much better. The Browns are most variable.
Of children 13-15.9 years old the mode advanced to 4.5 queries right and the Blacks did most poorly. The Browns are most variable.
Among the adults, on the other hand, the Blacks got the highest score and the Browns the lowest, and they are also the most variable. However, the Blacks differed from the Whites by less than the probable difference.
Thus the Black adults did surprisingly well in the number series test Is their success associated with their high sense of rhythm ?
g. Test VII (Analogies)
This is a test of ability to see analogies — to understand essential attributes, including relationship of things to each other, e. g., shoe — foot :: hat — kittens head knife penny. Obviously head is the word needed.
Of children 10 to 12.9 years (Table 268) the Blacks did very badly— worse than m any other test except Test IV for synonyms — antonyms. The Browns came next and the Whites were the best. At adolescence the Browns actually surpassed the others, and among the adults the Blacks stand first.
We conclude that in capacity for finding correct analogies the adult Blacks equal and possibly surpass the other groups. But they show no precocity in this respect; but quite the reverse. Between Whites and Browns is no significant difference. The Browns show the largest proportion of failures.
h. Test VIII
This test of "General Information" is a poor one for people in rural parts of Jamaica, since many of the reference are quite local. For example, "The Pierce-Arrow ear is made in Buffalo, Detroit, Toledo, Flint." Nevertheless, this disability applied about equally to all.
Among children of 10 to 13.9 years (Table 269) none could answer a third of the questions. The Browns did best and were most variable; and the Whites worst and were least variable.
Among children of 13 to 15.9 years there is a slight improvement with the Browns still leading and most variable, and the Whites and Blacks in the rear.
Among adults the Whites show a possible superiority, and the Browns do most poorly. The Whites are most variable. An excess of adult Browns failed entirely.
The adult Whites seem to show the most general information of the particular kind called for on the schedule; but this capacity develops late. Generally the Browns are the most variable.
i. Summary on Army Alpha Test
Means of scores — Means of the scoring are shown in tabular form in lame 270. In general, as is natural, the scores increase from 10-13 years to adult life. Thus the Blacks increase most in the 3 periods. The different race and age groups increase as shown in Table 271.
Thus, in general, the change in the score at successive age periods is as 3 : 5 : 9.
In the racial groups the means are seen to be highest in the Browns for toe submature groups and in the Whites for the adult groups. Thus the Browns appear to be precocious to 16 years and then slow up in their improvement, even more than the Blacks. But the Whites improve rapidly and, eventually, take first place (see Table 272)
Variability (S. D.) of the grades — The standard deviations for each of the Army Alpha tests for the three adult groups is shown in Table 273.
Here, in 6 cases out of 8, the Browns prove themselves the most variable. Once the Blacks are most variable — in respect to VII, analogies. Once the Whites are most variable — in respect to V, disarranged sentences. The fact that Browns are so generally the most variable in the result of this intelligence test suggests segregation. It may possibly be due to an unconscious selection of extreme types of intelligence for testing.
This matter may be further tested by considering the percentage of the grades assigned to any color group that falls into the upper quarter of the series and the lower quarter of the series, necessary adjustments being made where the classes are not exactly divisible by 4. The results are shown in Tables 274, 275.
Half of the cases of largest percentage of lowest grades of the above color groups lie in the Brown group. And the Browns have their proportional third-share of largest percentage of the highest grades.
The striking fact about the distributions of the grades of the Browns, as compared with the distributions of the grades of Blacks and Whites, such an excess of extremely poor scores, and naturally few of the median scores. This again speaks for segregation in mental matters. It tells more than this. It justifies the conclusion that the excess of low grades of Browns, as compared with Blacks, indicates that the mixture of. Black and White capacities, and instincts has produced an excessive proportion. of highly ineffective persons (as well as some normally effective persons). The view that the "mulatto" is superior to the Black holds for some members of the Brown group. From such mulattoes have come our Booker T. Washingtons, Fred Douglasses, Paul Dunbars, and the others. The equally widespread view that the mulatto is inferior to the full-blooded negro refers to this extraordinary proportion of individuals of low-grade intelligence, brought out by our statistics.
It will be instructive, finally, to consider in tabular fashion the relative standing of the means in the three color groups for each of the 8 Army tests. The results are shown in Table 276.
In Table 276 the letters A, B, C indicate relative mean standing of the three color groups in score on each test. This mean is followed by the probable error of the mean. In order to judge of the significance of the differences between the mean score in the various color groups, there, has been added, in parenthesis, the actual difference between the mean A and the mean B (or mean A and mean C, or mean B and mean 0) divided by the probable difference (√ (prob. error of A)2+(prob. error of B)2) It is generally recognized that, unless the factor in parenthesis is at least 2 (or better 3) times the probable difference, the difference is to be neglected. The first number in parenthesis (where there are two) is the factor tor the difference between A and B; the second for the difference between A and C. When there is only one number in parenthesis it is the factor for the difference between B and C. The larger the factor the greater the assurance that the difference is significant.
A careful examination of Table 276 reveals the fact that the most significant difference between the mean scores of the three color groups is III "common sense." Here the Whites score significantly much more than the Blacks or Browns.
The next most significant difference is found in IV, "synonyms— antonyms." Here the Whites are superior, probably to the Blacks, certainly to the Browns.
The next most significant difference is found in V, "interpreting pied sentences." Here the Whites are superior, possibly to the Blacks, certainly to the Browns.
Next in order of significance is the superiority in II, "arithmetic," of the Blacks, probably over the Browns, certainly over the Whites.
A very conservative interpretation of the differences might lead us to stop here, as having reached the end of significant differences. If we were to hazard another interpretation it would be that in VIII, " information," the Whites are superior possibly to both Blacks and Browns.
To summarize, the Whites gain significantly high scores in 3 Army tests, and the Blacks in 1. The differences in the score in the other tests are less significant.
Noteworthy is the result that the adult Browns stand lowest in 5 of the 8 tests, and occupy, in the other 3, a middle position that is not significantly different from the lowest In the Army Alpha test the highest adult standing goes to the Whites, the lowest to the Browns.
13. CORRELATION BETWEEN GRADES IN RHYTHM AND DRAWING GEOMETRIC FIGURES
The hypothesis was tested that there is a correlation between capacities — that a person who scored high in the test for rhythm should score high in the test that involved drawing outline figures (circle, diamond, square).
The coefficients lie at from -0.40 to +0.51. The highest coefficient (Black ♁) is based on only 4 individuals.
There is no clear evidence of the suggested correlation. The inherited factors for rhythm and drawing capacity are apparently quite distinct.
14. RELATIVE SOCIAL TRAITS
It seemed desirable to get as objective a measure as possible of the relative standing of Blacks and Browns in each of several social traits. The desirability of replacing individual opinion by group opinion, especially of basing that opinion on an adequate system, need not be discussed. Opinions vary and one person's is as good as another, in popular estimate, unless the opinion has an objective basis. Since social traits are, from their very nature, best judged by the social standing of the individual among his peers, the use of the method of relative standing seemed called for. This method of rating was much developed during the World War by the personnel division of the general staff of the IT. S. Army. One of us has used it in a study of the social traits of various European racial stocks (Davenport and Craytor, 1923).
In the present study 17 traits were considered, following precisely a "Graphic Rating Scale for Teachers" of Max Freyd, published by C. H. Stoelting Co., Chicago (No. 42,080). The following questions served as guide for the persons who were making the ratings.
1. How does he impress people by his physique and bearing? (Impressive, 100; repulsive, 0.)
2. Does he appear slovenly or neat in his dress? (Slovenly, 100; fastidious, 0.)
3. Is he self-conscious or self-possessed? (Painfully self-conscious, 100; extraordinarily self-possessed, 0.)
4. What is his social attitude? (Breezy, 100; formal, 0.)
5. How much physical energy does he put forth? (Sluggish, 100; full of pep, 0.)
6. Is he alert or absent-minded? (Alert, 100; absent-minded, 0.)
7. Does he display a sense of humor? (Sees funny side of everything, 100; takes everything literally, 0.)
8. Does he give in to others or does he assert himself? (Meek and submissive, 100; aggressive, 0.)
9. Is he tactful or tactless? (Extremely tactful, 100; antagonizing, 0.)
10. How popular is he with his students and associates? (Detested, 100; popular favorite, 0.)
11. Is he prejudiced or fair-minded? (Prejudiced, 100; always impartial, 0.)
12. Is he patient or impatient in dealing with pupils? (Patient, 100; irritable, 0)
13. What ability has he to take and act on criticism? (Welcomes criticism, 100; resents criticism, 0.)
14. Can he think quickly when facing a group? (Floored by unexpected questions, 100; never at a loss, 0.).
15. How fluent a talker is he? (Taciturn, 100; loquacious, 0.)
16. How clear and distinct is his enunciation? (Very distinct, 100; very indistinct, 0)
17. What is the extent of his interest in teaching? (Regards as drudgery, 100; consuming interest, 0.)
The findings from the judgments are shown in Table 277. The following differences seem to be significant.
The Blacks appear, on the average, of the two groups to be: (1) the less impressive in bearing (2.8) ; (2) the less fastidious (2.4) ; (5) the less inergetic (2.6) ; (10) the less popular (4.1) ; (11) the more impartial (3.1) ; (14) the more easy embarrassed when facing a group (3.7) ; (16) the less distinct in speech (3.3). The numbers in parenthesis give the difference divided by the probable difference. In all the above cases but No. 2 this is more than 2.5.
15. TEACHER'S ESTIMATES OF ATHLETIC ABILITY, LEADERSHIP AND SCHOLARSHIP
At MicoCollege an estimate of standing, judged independently by each of 5 teachers, was made of each of 7 Blacks and 22 Browns. Of the teachers 2 were White and 3 Brown. The judgments were made on a threefold classification, as follows: average "2," below average "1," above average "3."
Table 278 indicates that there was no difference (so far as opinions of teachers go) in the athletic ability of Blacks and Browns. The Blacks are apparently superior to the Browns in leadership, while the Browns surpass the Blacks in scholastic ability.
16. SUMMARY OF OBSERVATIONS ON MENTAL TESTS
It is a matter of supreme importance to know what is the relative intelligence of Blacks, Browns and Whites taken at about the same social stratum. The matter of comparative intellectual capacity of different races has been little investigated. There are those who deny that we have, indeed, any evidence of difference in capacity of the different peoples of the earth.
In musical capacity, in general, the Blacks stand first and the Whites last. In form discrimination there is no certain difference between the color groups. In copying planes figures and drawing the man the Whites excel; the Whites also put the parts of the manikin together in the least time. In imagining what figure the notched paper will give when unfolded the groups did not differ significantly, but it seems probable that the Whites had a little more accurately than the colored groups. As for fitting blocks into mortised space and in the form substitution test the Whites worked faster and more accurately than the colored persons. Also in the cube imitations tests were clearly superior.
In the repetition of seven figures the Blacks stood first; but in the criticism of absurd sentences the Whites were superior.
In the Army Alpha tests the adult Whites scored highest, and got first place in half of the 8 tests given. Yet they are surpassed by Blacks in arithmetic, certainly, and in test VII, probably.
In musical discrimination, in repetition of 7 figures and in certain mental arithmetic computations the Blacks surpass the Whites, but in all other mental tests the Whites are equal to or clearly ahead of the colored groups.
PART VI — FAMILY STUDIES
The present hook deals not primarily with families; but with racial hybrids. Incidentally, several members of a few families came to be studied intensively. It has seemed desirable to compare members of these (mostly inbred) families to observe resemblances and differences between them.
1. THE KAMEKA FAMILY
Among the families of German origin that settled at SeafordTown is one bearing the name "Kameka." This is not a common German name, surely; it has possibly become modified in spelling in the course the three or four generations since the Germans arrived at Jamaica.
A pedigree chart of this family is shown in Plate 29. The black symbols indicate marriages between cousins of some degree. The crosses in the "symbols" refer to persons who were measured and are especially considered in the text.
The details of interrelationship in Kameka marriages are given in Table 332. Other intermarriages, in allied lines, are listed in Table 333.
Our problem is: What inheritance is shown in these inbred branches of the family? So we examine the family in detail. [Acknowledgment is made of the assistance given by Mr. Louis Kameka (No. 31) and Mr. Hugh Gardner (No. 132) in preparing this pedigree table.]
We start with a progenitor (C. K., No. 1) who was a victim of homicide at about 40 years. He was already father of 8 children. His wife (A. F.) died at 90 years of "old age."
I. The first child was a daughter (No. 3). She married in the colony a planter. They had 7 children. The mother died at 96 years of old age; the father, at 80, of "indigestion."
Of their children the eldest (C. S., No. 11), still living, at 76, has been schoolmaster. He married a first cousin, daughter of the fourth child (No. 42); she is living at 62 years. They had 9 children (Nos. 62-70), planters, cultivators and housewives. Two of them have migrated to the United States. At least 15 children are known in the following generation.
Of the product of the first-cousin marriage (Nos. 11, 11a=42), numbered 62-70, the first is Sanford Somers, a planter, of SeafordTown. By his wife he has 8 children. A sister is a nun in the Kingston convent. The next brother is a cultivator at Coffee Ground; has 5 children. The next is in the United States; has 3 children. Then come two sons who are cultivators; then a daughter, who is a domestic. Another sister is in the convent. Finally are two brothers of whom one has been measured.
The second child of No. 3 is a woman (M. S., No, 12). She is living at 70 years, and with her now paralyzed husband has been engaged in agriculture and the rearing of her family of 6 children. One of these died of "fever." The others are living at SeafordTown (or Coffee Ground), and there are 21 children in the next (or fifth) generation.
The third child of No. 3 was No. 13; she died in infancy.
The fourth child of No. 3 is E. S. (No. 14). He married a woman of the same surname that his mother bore before marriage. He died at 66 of "indigestion." They had two sons living in SeafordTown of whom one is a cultivator and one a sailor.
The fifth child of No. 3 is L. S. (No. 15). .She kept a shop and died at 69 of cancer. Her consort died at 40 of drink. They bad 6 children. Of these the first lives at Orange Hill; married a descendant of one of the original immigrants, and they have 5 children. The second is a cultivator of the soil; married a Kameka, a first cousin once removed, who is a shoemaker; they have had 14 children (11 surviving; see under No. 56). The third also married a first cousin once removed, a cultivator, and they have 9 children. These will be described under No. 59. The fourth child (No. 82) is a cultivator. He married a daughter of one of the original settlers, and they have 5 children. The fifth child (No. 83) is a farmer at SeafordTown, unmarried. The sixth (No. 84) married his second cousin; they live in the United States, and have one or more children (see No. 214).
The sixth child of No. 3 is A. S. He is a veterinary and is living, at 66 years, at SeafordTown. He married his first cousin, who is still living, at 52 years. They have had 12 children (Nos. 85-96). Four are dead; leaving 2 children. One has gone to the United States. Of this fraternity one (S. S., No. 91) was carefully examined.
Thus of the descendants of No. 3 we have studied carefully 1 son and 4 grandsons, nephews of the son. They are William Somers (No. IT), Refert Somers (No. 69) and Sylvester Somers (No. 91), also 2 others. Photographs are shown in Plate 9, Figs. 1, 3, 4.
The comparative Table 334 reveals a great similarity between these three closely related persons; two being the product of first-cousin marriages. There is hardly more than an inch difference in stature, which is rather short for persons of German origin, who average about 169 cm. instead of 167. They are also of a slender build (Index, English system, about 29). The iliospinale height (which is one of the most accurate points to measure to) is practically the same in all. Though the legs are of the same length there seems to be a real difference in arm length; for this is shorter in Sylvester. The chest girth is the same in uncle and one nephew, and only slightly greater in the other nephew. The head length varies from180 to 189 mm.; head breadth from 136 to 145 mm. Nose breadth varies from 33 to 35 mm. The nose index is least in the uncle. The length of the foot is also rather similar. On the drawing of a man the uncle scored 11, and the nephews 13 and 11 respectively.
II. The second member of the second generation is Charles Kameka. He was a shopkeeper at Lamb's River, and died at 86 years of cancer. Ho married twice. His first wife had the name of Whittingham, which appears not to have been one of the names of the German colonists. It is a name found among the colored people. By this woman (who died of childbirth when 33 years old) he had three children. The first was a carpenter, who died at 70 years of heart disease. He married a colored woman, who died at 48 of typhoid fever. The second was a shopkeeper and remained a bachelor; dying rather young. The third was a cultivator who lives (now aged 69) at Cambridge. He has a colored wife.
Charles Kameka married a second time a woman by the name of Harris. By her he had 7 children.
III. The third member of the second generation is Augustus Kameka. He was a shopkeeper at SeafordTown, and died at 56 of cancer. His widow (nee Maria Swinksman) is still living at the age of 90 years. They had 12 children (Nos. 28-38).
1. The first died at 3 years of croup.
2. The second is a cultivator of the soil. He lives, at 68, at SeafordTown, where his wife (nee Augusta Hacker), of the German colony, now lives at the age of 63 years. They have 9 children as follows:
a. Sylvester, a cultivator at SeafordTown; married one of the German colony. They have 2 children.
b. Elizabeth, married her third cousin.
c. Adelbert, married a Hooker, a first cousin; they have 4 children.
d. James, a shoemaker.
e. Edward+, a carpenter. See Table 338.
f. Louis, a cultivator; married one of the German colonists. They have 2 children.
g. Cyril+, a cultivator. See Table 338.
h. Alice, married one of the German colonists,; has 2 children.
i. Ethel.
The foregoing family has remained in SeafordTown.
3. The third child of No. 5 (Wilhelmina), married a descendant of one of the original German colonists. They had 10 children.
a. Eva (No. 115), married and living in the United States.
b. Anetta, married a Gardner, a shopkeeper. They live at Coffee Ground.
c. Adam, married a colored woman; lives in Panama.
d. Alexander, lives in Cuba.
e. Herbert, a cultivator, lives at Coffee Ground; married into the German group; 2 children.
f. Landriana, lives in United States; married.
g. Celest, in Panama.
h. Ethel; married one of the Germans, a cultivator in Coffee Ground.
i. Liburna, dead.
j. Marie, lives in Coffee Ground; is single.
4. The fourth child of Wilhelmina is Louis (No. 31), a carpenter, still living at 63 years. He married into the German group, and his wife survives, aged 55. They live at SeafordTown and have had 7 children as follows:
a. Augusta (No. 125), dead.
b. Artemesia, dead.
c. Kanier, in Cuba.
d. Julia+, in SeafordTown. See Table 338.
e. Mary, dead.
f. Vincent, a cultivator, at SeafordTown. g. Hyacinth, a seamstress.
5. The fifth child of Wilhelmina is Matilda+ (No. 32). She is living at 60 years. Is married to one of the German colony, George Gardner, an agriculturalist of SeafordTown, living at 62 years and possessed of 125 acres of land. Both were measured. They have had 10 children.
a. Hugh+ (No. 132), of SeafordTown.
b. Lydia, married and living in the United States.
c. Leo, married to one of the German colony.
d. Rennie, dead.
e. George, living in the United States,
f. Evelyn, an agriculturist, at SeafordTown.
g. Aswold, a cultivator.
h. Eric+, a mechanic.
i. Leonard, a cultivator. ;
j. Noel.
6. Augustus (No. 33) is a painter, living, at 56 years, at SeafordTown. He married one of the German colony, and they have 4 children.
a. Agatha (No. 142), who married a Chinaman.
b. Oswald+, a cultivator at Coffee Ground; married one of the German colony and has 2 children. For Oswald's measurements see Table 338.
c. Lila, who married one of the German colony, a shoemaker, living at SeafordTown.
d. Pascal.
7. Charles, dead.
8. Edward (No. 35), a shopkeeper, who died, at 42 years, of alcoholism. He married a colored girl, who is living at 52.
9. Fred (No. 35c), a cultivator, living at SeafordTown, aged 46 years. He married a Gardner, who is living at 44 years. They have ha 8 children.
a. Ewin, living in the United States.
b. Noel, a cultivator, living in SeafordTown.
c. Dorothy+ (No. 148), SeafordTown. See Table 338.
d. Lilian, living in Kingston. e-h. Children, at school.
10. Ignatius, died at 24 years of an accident.
11. Raphael (No. 37), a cultivator, living, aged 44 years, at SeafordTown. He married a second cousin, Maria Brown. They have 9 children, all still of school age, or under. •
12. Gabriel, a cultivator, living, at 42 years, in SeafordTown. He married a Gardner girl, and they have 10 children.
a. Gladstone, studying for the priesthood at Kingston.
b. Lucile, married Leo Somers, a mechanic. They have one child.
c. Erna+ (No. 165). See Table 338.
d. Genevieve+. See Table 338.
e-j. Mazie, Louis, Marie, Nellie, Hazel and Arthur.
Of the descendants of Augustus Kameka and Maria Swinksman, one daughter, Matilda, and her husband, George Gardner, and 2 of their sons, also 8 first cousins of the latter were measured. The results of the measurements are given in Table 335.
[+ Indicates that the person was measured.]
IV. The fourth child of Charles Kameka is Henry (No. 6), a cultivator, of SeafordTown, who became blind and died at the age of 90 years. He married Caroline Siekert who died of old age at 90 years. They had 9 children, who are described below.
1. Josephine Kameka (No. 39), who died at 16 of typhoid fever.
2. Mary, who died at .12 years of hookworm.
3. Alice, who died in infancy of croup.
4. Emma, who married her first cousin Charles Somers, and had 9 children as described at 11a (p. 429).
5. William, a shopkeeper at SeafordTown, who died at 49 years of alcoholism. He married Margaret Groskopf of the German colony. They had 5 children. She is living, aged 40 years, in the United States.
6. Henry (No. 44), a cultivator, living at 48 years, in SeafordTown. He married Agnes Kameka, who died at 22 years in childbirth. By his second wife, Ethel Brown, he had 9 children, of whom 7 died. The two remaining are numbered 178 and 179 on the chart.
7. Louise, who married Augustus Eldimere, of the German colony. She is still living, at 55 years. He died at 50 years of an ulcer. They have had 2 children and 4 grandchildren.
8. Josephine. She married Cornelius Hacker, a cultivator, with 18 acres of land. Both axe living at 44 and 50 years respectively. They have had 9 children.9. Oliver, a cultivator of about 10 acres, living at SeafordTown. He married Edith Brown, his second cousin. They have 8 children: Jerome, George, May, Olivia, Agnes, Betty, Doris, and Richard, mostly of school age.
V. The fifth child of Charles Kameka is Louisa (No. 7), who married Fred Bunamann. They had 3 children. She died, aged 30, in childbirth. He was a blacksmith and died of a gunshot wound at 56. Their eldest child was Charles, still living at SeafordTown, 64 years, a blacksmith. He married Caroline Somers, and they had 12 children, Nos. 199 to 210 of the chart. Then there are at least 22 children of the following generation.
VI. The sixth child of Charles Kameka was Matilda. She married William Foss. She died at 40 years, by poison.
VII. The seventh child of Charles Kameka is Herman (No. 9), who is still living in SeafordTown, at the age of 86 years. He is a cultivator with 35 acres. He married Louise Rimann who died at 70 years. They had 7 children as follows:
a. James (No. 51), a cultivator of SeafordTown, living at 60 years. He married Annie Bunamann, a first cousin. They had 8 children. Ruth (who married Jack Kameka and has 2 children), Basil and Evadne (whose measurements are given in Table 337), and Enid (who married a Brown and has 1 child). There are 4 others.
b. Edith, who married Augustus Somers (No. 16), and whose children are listed in her husband's part of the chart.
c, d, e. Joseph, Samuel, and George, who died in childhood at about the same time of typhoid fever.
f. Alexander, who married his cousin Wilhelmina Brown (No. 80). They have had 11 children (Nos. 219-229). Of two of the children, Hugh and Edith, the measurements are given in Table 337.
g. Adolphus, who married Caroline Gardner. They have had 4 children of whom Lester and Gladys have afforded their measurements in Table 337.
VIII. The eighth child of Charles Kameka is Edward (No. 10). He was a cultivator, with 16 acres, and died at 70 years of a heart attack. He married Louisa Bishop, of the German colony, who is living at 72 years. They had 4 children as follows:
1. Edith, who died in childhood.
2. Augustus, an agriculturalist, with 20 acres, still living at SeafordTown, at the age of 48 years. He married his second cousin Amy Brown.
They had 9 children, of whom Vincent is married to one of the German colony and has one child. The third son, Wilfred, has afforded his measurements as given in Table 336.
3. Emma, who married Robert Scarlett of the German colony, and died at 40 years of influenza. He is still living at 50 years; and cultivates some 10 acres of land. They had 6 children, and of these, the eldest, Leigh, has given us his dimensions as printed in Table 336.
4. Agnes, who married her first cousin Henry Kameka, as considered under Henry, No. 44 (p. 433).
We now give a comparative table of the finger patterns of a number of cousins and closer relatives of the Kameka clan (Table 339). As a whole this inbred family series is remarkable for an extraordinary high incidence of arches, 14 per cent as compared with a German mean of about 7 per cent. Radial loops are also very numerous (13 per cent as opposed to an average of about 6). Whorls, including twisted whorls, are relatively few (18 per cent as opposed to an average of about 22 per cent).
Individual pairs are often very similar in types of patterns. Thus Genevieve and Erna K.; also Hugh and Edith K. (Table 339) show a 29large proportion of arches; Basil and Evadne have almost exclusively ulnar loops. Lester and Gladys have many whorls. But while Cyril has many ulnar loops, his brother Edward has none — and many radials like his first cousin Oswald. Thus some striking evidence of fraternal resemblance there is, but sibs are not always alike in finger prints any more than in eye color.
As to size of pattern we note that it is small in the case of both Hugh and Edith, and large in both Lester and Gladys.
Table 340 gives the finger-print patterns for one of the Gardner-Kameka families.
Here we have unfortunately only one of the parents. One of the sons shows uniformly ulnar loops. The other 4 whorls and a radial loop in the 4th finger besides 5 ulnars.
2. THE J. FAMILY
This is a high-class dark brown family of which the father is headmaster of the Mico PracticingSchool and the mother is a teacher in that school. Her mother's father was the son of a Scotchman and a Negro. Mrs. J. was one of a fraternity of 8 of whom 4 died young; 3 are teachers, one is in U. S. A. her family, as a whole, shows many teachers.
A brief comparative table of some somatic traits in this family has been prepared (table 341). From this table it appears that the father's skin color is much darker than the mother's, and that one of the children's skin color is like the mother's and 3 are like the father's.
the relative span is greater in the father than in the mother, and intermediate in all of the children except no. 3, whose ratio is so extreme that there is a little doubt about its accuracy.
The relative sitting height is slightly under 50 per cent in both parents; still less in the 2 children at 15 and 13 years — the years of longest relative leg length. it is over 50 per cent in the children 12 to 7 years — which is an age before full leg length is attained.
The head width — head length — or cephalic index — is 80.4 in the father and 74.5 in the mother, who is thus much the more dolichocephalic. All the children have an intermediate form of head except the 7-year old who still retains the brachycephalic tendency of childhood. However, the heads of the children tend to be of the paternal brachycephalic dominant type.
The chest girth — stature — the index of body build — tends to reach a minimum at 12 to 13 years, touching, on the average, about 45 per cent. In old persons the build index rises to over 50 per cent both parents have a body build of over 50, and are rather heavy. Children nos. 1, 2 and 3 have the adolescent slenderness. No. 4 is rather stout for her age. No. 5 is slender for a boy of 71/3 years.
Hair form — The calculations of diameter of hair curl in millimeters
Here the 3 children have the more open curl shown, phenotypically, by the mother.
Tooth decay — The father had 6 upper and 6 lower teeth remaining (table 342). The mother had 2 upper and 9 lower teeth remaining.
Already one boy at 15 years has 7 teeth more or less badly decayed. This family lends no support to the view that Brown or Black families have more resistant teeth than Whites.
Papillary patterns — This family is outstanding because of the fact that it shows only 1 per cent arches (Table 343), and no radial loops, but 76 per cent ulnar loops where 60 per cent is the average for humans in general. Whorls occur in 23 per cent, which is near the average, but twisted whorls are apparently unusually common. The high rate of ulnar loops is doubtless a repetition of the parental conditions which show 85 per cent ulnar loops and no radial loops. The father shows 2 twisted whorls.
3. THE P. FAMILY
At halfway tree near Kingston, Jamaica, lives the P family (Acc., p. 2048) a "Brown" group. This consists of the following: G. N. P., b. 1887, father (col. 1) ; U. P., b. 1888, mother (cols. 2, 3); and 7 children: (not at home), O. in U. S. A., Ivy♀ (cols. 4, 5), Mavis♀ (cols. 6, 7), Veva♀ (18 years old, cols. 8, 9), Mae (15 years, cols. 10, 11), and Ronald (still a child).
Their measurements are given in table 344. The female dimensions are referred to a male standard. All have attained full size of bony development
Weight is still undeveloped in the children. in stature each of the children exceeds either parent. The mother has a short span, the father a very large one — the children have a great absolute and also relative span.
Long appendages seem to dominate. sitting height is tolerably uniform in parents, and in all children except the oldest relative sitting height, being inversely correlated with appendage length, is relatively short, as in the father (except in the, case of the eldest girl who resembles her mother in this respect).
Chest girth both absolute and in relation to stature is low in all the children, who retain the slenderness of youth. The head length is not very variable through the family. Head width is narrow in the mother and three children, and broad in the father and one child. in cephalic index three children resemble the mother and one the father. Segregation is suggested.
This (P.) family is characterized by an extraordinary uniformity of papillary pattern (table 345). Both father and mother have a total of 16 ulnar loops in 20 fingers, or 80 per cent, while Jamaican Negroes in general have only 60 per cent of ulnars. The children have 43 ulnar loops in 50 fingers, or 86 per cent radial loops occur in 10 per cent of the children's fingers, which is 4 times the Jamaican negro rate. Not a single whorl occurs in the 50 fingers of the children; though 14 are to he expected did the children show the rate of the average of the Jamaican Negroes. This is a good demonstration of the tendency of the pattern to run in a family.
In other words, all hair has a fairly open curl.
4. A STUDY OF SIBS IN AN INBRED COMMUNITY
Two pairs of sisters from the Bodden and the McTaggert families respectively of Grand Cayman island were measured. Grand Cayman 18 characterized by much intermarriage; and this tends to make progeny homogeneous. The results are shown in Table 346. This table includes, also, measurements of two young men at Kingston.
In making the comparison it must be appreciated that even repeated measurements of the same individual do not give precisely the same individual do not give precisely the same results, because of the movements of the individual and the lack of precision in the points to which measurement is made. For the larger measures an error of up to 10 mm. is to be expected. In head measurements greater precision is to be expected in within 2 mm.
The Bodden sisters are of practically the same height. The net arm lengths (from acromion to stylion) are respectively 499 and 508 cm. The "span" measurements happen to be identical. The absolute sitting heights are within 10 mm. and the kneeling heights so similar as to suggest nearly identical proportions of the legs. The shoulder (biacromion) breadth is the same and the transverse chest diameters are very like, but the chest girths are dissimilar, possibly having been taken at different phases of respiration. The girths of wrist and arm are closely similar.
The diameters of the head are remarkably close; the length and width might have been taken from the same person. The distances between eye angles are identical. The forms of nose and ear are very like. The sagittal measurements of the facial features vary within 5 mm.; they are sufficiently different to serve as recognition marks to friends. While the foot dimensions are not very like, those of the hand are practically identical.
The McTaggert women are very unlike the Bodden girls. The older is married and is putting on weight. She is 1.4 cm. the taller, a difference easily obtained on one and the same person according to the degree of straightening up. The arm lengths differ by only 10 mm.; but are very unlike those of the Bodden sisters. The transverse dimensions of trunk of the older, stouter sister are much larger than those of her slender sister. The head of the older sister is the larger, especially the broader; and so is interpupillary distance. The nose is of the same length in the sisters, but of greater breadth in the stouter one.
The Cover men are naturally taller than the women; they differ from each other by 6 mm. in stature. The younger has arms that are about 3 cm. longer than his brother's, as is shown by "acromion to stylion" and "span." But the legs of the younger brother are apparently the shorter by 2 or more centimeters. Allen has the longer head, but the other head diameters are practically identical. The nose is of the same size and proportions, except that it may be slightly higher in Douglas. Interpupillary distance is 3 mm. greater in Douglas. The sagittal face distance is closely alike.
As one reads along the lines one sees that the dimensions of members of pairs are more like each other than are the measurements of unrelated pairs. We get a view of the workings of the hereditary factor, though obscured as in the McTaggert sisters by differences in age and weight
The Kameka brothers, Edward and Cyril (Table 338), are very different in build and proportions. Their parents and grandparents were not inbred. Cyril is the taller; has longer arms and legs and longer head, but the facial features of these men are quite similar.
The Kameka sisters, Genevieve and Erna (Table 338) are also not the product of close inbreeding. They are closely alike. Stature, span, sitting height, kneeling height, biacromion breadth, girth of wrist and neck, nasion to gnathion, head diameters differ hardly more than successive measures on the same person taken at least a year or two apart.
Even the first cousins (Table 338), apart from sexually dimorphic differences, show many points of close similarity.
A father, mother and 2 sons of the inbred SeafordTown community were measured. The mother's measures were, as far as our data permit, transmuted into the corresponding male measures (Table 335). The result is not always helpful. For example, Matilda G. has large hands, the result of much labor. To reduce to male proportions we divided the hand measurements by the female/male index obtained largely from young women, who had done little manual labor. The index was too small, and this makes Mrs. G.'s reduced hand too large. For the same reason the transmuted chest girth comes out larger than the genetic factors involved warrant. With these limitations let us compare data on parentage and progeny, as given in Table 335.
Statures of F., M., and Erich are practically identical; Hugh is 5 cm. short Span of the sons is short Sitting height (vertex) is different in the parents; one son is like each parent Arm length (acromion to stylion) is short in the shorter son. Biacromial breadth varies between 372 and 411 mm. The foot lengths of all four persons have great resemblance (259-263 mm.). The nasion to gnathion length of the boys is unexpectedly big; other genetic factors that do not show phaenotypically in the parents must be active in facial proportions. Head length is remarkably uniform (186-195 mm.), and so is head width (146-152 mm.). In nose height the boys are more like the mother than the father.
Summary — A comparison of sibs in inbred communities sometimes gives strikingly uniform dimensions, even such as might be found in "identical" twins. But certain features in such persons may be aberrant. This indicates that there are different form-controlling factors active in the development of different parts or organs.
5. A STUDY IN IDENTICAL TWINS
Three pairs of similar (believed to be monozygotic) twins were examined. The results are given in detail in Table 347.
a. The Webster Twins
To begin with the oldest: Carl and Clive Webster, 27 years of age, white (Plate 28, Figs. 1 and 2), have weights respectively of 150 and 164 "pounds. The statures are 1779 and 1786 respectively, within the limits of error due to shifting posture. The suprasternales are 1455 and 1459 respectively (practically identical), and the head-and-neck are 324 and 327 in each. The cristal height in each is 106 cm. The leg length, which is iliospinale height, — 40 mm., is 978 and 946 respectively, a difference that is probably due in part to inaccuracies of measurements; for, " stature — sitting height" is 839 and 841 respectively, and this distance is regarded as proportional to leg length. There is a slight difference between the tibiale heights, but the kneeling heights are so similar that there is probably no difference in the lengths of thighs and of lower legs in the two men. The span is the same within limits of error. The arm lengths (acromion to stylion) agree to within 2 mm. Biacromial and intercristal breadths are 14 mm. larger in the heavier man. Chest-and-wrist girths are practically identical, but the neck girth is larger in the heavier man. Olive, the heavier, has a slightly longer hand and foot, but the breadths of the parts are nearly the same respectively. Measurements of head and facial features are as alike as though taken twice on the same head. Olive's pinna is slightly the shorter. Both eyes are No. 7 in Martin's scale. Carl has "3 brown spots in the right eye "; Clive has " 4 brown pigment spots ia right eye."
Teeth — The condition of the teeth is indicated in Table 348. In these 27-year-old men the median incisors are healthy or normal (N); Carl has lost his right upper I2, and the left is filled, but all other I2, in him, and all in Olive, are N. All canine teeth are N. There are 3 cases out of 8 P2's that are not N; and P2 shows decay in both of the twins. All but one of the 8 Mi's show decay; and 6 out of 8 M2. All M3's are present. Olive shows somewhat less dental caries than Carl. Probably from similarity of constitution and nutrition the dental condition is fairly similar.
Mental tests — On the cube imitation test Carl scored 7; Clive, 5. The manikin was put together by Carl in 45 seconds; by Clive, in 50 seconds. The Knox moron test was done by Carl in 35, and then 65 seconds; by Clive in 40, then 40 seconds. In the folded paper test Carl predicted one diamond; while Clive said two diamonds, and was right Both would seek the ball lost in a circular field by walking in concentric circles. The mental traits of the men are thus quite similar.
b. The Salmon Twins
The Salmon brothers, Edward and Osmond, are white and 17 years of age. They look alike. The statures (Table 347) are 1802 and 1790, within the limits of changing posture. The vertex-suprastemale (head-and-neck) distance is about 1 centimeter the greater in Osmond. The leg length is probably nearly a centimeter the shorter in Osmond; for both tibiale and kneeling heights are shorter in him. The span is equal in the two men, and the arm length and biacromion breadths are sensibly equal. The intercristal breadths are alike. Considering possible variations in the folds of the shirt, chest girths may be regarded as practically the same. Wrist girths are alike. Hand lengths and breadths are identical, and foot dimensions are exceedingly close. The head measurements are as though taken twice on the same head. But the facial features, and especially the chin, seem to be longer in Edward. The hair on arm and hand is developed to about the same degree.
Teeth — The condition of the teeth is indicated in Table 349. If the record is wholly reliable-it would appear that the teeth of Osmond are more resistant than those of Edward.
Mental tests—
a. Cube imitation — Edward missed No. 7 and the last of the set of this test. Osmond did No. 9 and missed the later ones. See page 41.
b. Manikin test — This was put together by Edward in 25 seconds; by Osmond in 45 seconds.
c. The Knox test was done the first time by Edward in 40 seconds, by Osmond in 7 seconds; the second time by Edward in 40 seconds, by Osmond in 25 seconds. Osmond was much the quicker.
d. Absurd sentences — Edward understood all correctly; Osmond did all, but required additional explanation of the first question.
e. Folded paper test — both drew a star as an indication of what the unfolded notch would look like.
f. Defects and disease — Edward reported no diseases. Osmond reported 1 attack of pleurisy, a chronic malaria and asthma.
g. Avocations — both boys like football, swimming and dancing; singing, mandolin playing. Both are especially fond of machinery, poetry, acting (or drama) and chemistry. Osmond, alone, expressed fondness for carpentry, and Edward, alone, for surgery. Both admit excitability; prefer rural to town life and like travel; are fond of tobacco, and are not interested in religion.
In the form substitution test Edward did 50 in the allotted time, and Osmond 43; both without errors.
In the form discrimination test circles only were considered. Edward required 6 minutes, and got a score of 54; Osmond took 5 minutes, and got a score of 64.
No great agreement appears. Evidently the hereditary control does not extend to the details of musical capacity.
In this intellectual test Edward appears clearly superior. Especially in test 7, involving comparison, Edward did much the better. Also in test 4, involving opposites, and test 5, involving truth and falsity, he was superior.
Table 351 gives the papillary patterns for the two hands of Osmond and Edward. This table is rather interesting, inasmuch as all fingers have the ulnar loop except No. 2 left, which shows a twisted whorl in Edward and a radial loop in Osmond. The exact number of ridges around the core varies slightly. On the whole, the papillary ridges of the fingers are closely similar.
c. The Ebanks Twins
These 14-year-old Brown girls have a great facial resemblance and similar form of hair (Plate 28, Fig. 3), but differ somewhat in dimensions. Ina is 4 cm. the taller, and has a leg length about 24 mm. longer. Ina stretches 6 cm. farther, although her shoulder breadth is not greater. Her net arm length (acromion to stylion) is 14 mm. longer. Her intercristal breadth is only slightly, if any, greater. But in Ina chest, wrist and neck have larger girths. Feet and hands differ slightly in form in the twins, but cover the same area. The dimensions of head and face might (except perhaps for head length) have been obtained by successive measurements of the same person.
Teeth — The condition of the teeth is indicated in Table 350.
The teeth were without decay and the M2's were developed on the lower jaws, but not yet on the upper.
Mental tests—
1. Drawing geometric figures — The twins got 81 per cent each on the circle, 99 per cent on the diamond and 88 per cent on the square.
2. Drawing of a man — Each got a score of 8. Ina drew a profile, but without legs; Vyna, a full face, a trunk like the figure of Ina's and 1½ legs.
3. Folded paper — Both predicted that 2 diamonds would appear on opened paper.
4. Field and lost ball — Each drew a straight line from circumference to center.
5. Absurd sentences—
To Question No. 1 about the dead bicycle rider who may not recover, Vyna replied: "He fell off because he rode carelessly," and Ina said: "It is because he rode carelessly."
To the statement about 3 brothers including myself, Vyna said: "You have only 3 brothers with yourself," and Ina said: "It is not foolish."
To the statement, "May you live to eat the chickens that scratch your grave," Vyna said: "He can not eat chickens because he is already dead," and Ina said: "Because he would not live to eat the chickens."
To the "not serious" accident in which 48 people were killed, Vyna replied: "That," and ceased. Ina said: "It is not foolish."
To the statement about the man who wrote on his letter, "If you don't get this letter, let me know," Vyna replied: "You couldn't give him any answer because—," and Ina said: "It is not foolish because ho might want to know something special in the letter."
The foregoing questions are supposed to fit the mentality of the French child of 11 years, but they are poorly grasped by these 14-year-old twins. They seemed to show about the same partial grasp of some of the sentences.
Repetition of 7 figures — Vyna gives 7% and Ina 6% series in response; and the recollection was about equally imperfect in both children. (This is an 11-year-old test.)
Form substitution tests — Vyna marked 26 and Ina 55 symbols, all correctly.
Form discrimination — In circles and triangles Vyna did slightly better than Ina, but, on the octagons, worse.
These series are remarkable for the close resemblance of the two girls in discrimination of pitch and intensity. Ina has, however, no such delicate discrimination of time as Vyna shows.
Table 352 shows the papillary pattern on the finger of Ina and Vyna. This table is striking for the exclusive presence of ulnar loops on all fingers. Also most of the line values are of only median size and closely similar on the twins. All 4 thumbs have the circular pattern. Two ellipses occur in Ina's fingers and 4 in Vyna's.
d. Summary on Identical Twins
Of the identical twins in the Webster and in the Salmon families, the most amazing resemblance appears between the members of each pair. The measurements of the heads are as alike as repeated measurements on the same individual head. The Ebanks twins are less close. But all 3 cases show that, under fair developmental conditions, persons with the same hereditary developmental impulses develop the same size and proportion of parts. This conclusion merely confirms what others have found; but we think, so detailed a series of comparisons of measurements has not hitherto been published.
6. TWO MULATTOES
a. Among the Browns measured at Kingston was a man whose mother was said to have been Black and whose father was Scotch. As a practical representative of an F1 generation he is of special interest. No measurements were made on father or mother, since they were inaccessible.
The young man in question (Acc. No. 3746) is nearly 24 years of age. His stature is 171.0 cm., which is close to (slightly above) the mean of the Blacks. As the Scotch father was presumably tall, there is here no evidence of heterosis. The span is 179.1 cm.; the relative span is 104.7 per cent, which is below the mean of Blacks; and a little above the mean of Browns, though it lies in their modal class.
The nasal breadth is 37 mm. which lies in the narrower 10 per cent of the Browns, and the nose index is 72.5 which, again, lies in the smallest 10 per cent of the nose indices of Browns. Small nasal index is dominant, as Fischer (1913, p. 173) finds to be probably the case in Hottentot-Dutch hybrids.
The interpupillary distance is 64 mm. which is in the narrower 10 per cent of such distances found in Browns, and is even below the mean of Whites. In relation to head width the interpupillary distance is 41.5 per cent, which is low even for Whites. This hybrid has eyes that are rather strikingly close together, suggesting dominance of narrow interpupillary distance. The face length — face breadth is 89.9 per cent which is about modal for Browns.
The hair is heavy in eyebrows and 8 mm. long, and heavy on arms, as frequently found on Brown males.
The skin color is represented by the formula: W 20, Y 22.5, K 30, 1ST 27.5. This is about what Davenport and Danielson (1913, p. 11) found as the modal conditions among F1 hybrids of Bermuda.
The intelligence of this person is indicated by the grade of 3 obtained on the Army Alpha test. He could write his name and received credit of 14 for the drawing of a man — indicating considerable clearness of ideas. On drawing of the geometric figures he received 63, 77 and 66 per cent respectively. In the cube imitation test he did number 8 correctly, but no other. To 3 only of the foolish sentences did he give correct criticism. The manikin test he did incorrectly after 30 seconds. The Knox moron test he did first in 95 seconds, and second in 10 seconds. He concluded that the folded notched paper would yield a single diamond when opened. On the whole, the grade of this man was below that of an 11-year-old child. Especially was he deficient in arithmetic, common sense, insight into similarities and opposites, ability to make sense out of mixed-up sentences, and insight into the "rhythm" of numerical series.
b. Florence S. (Acc. No. 1988) is a young woman of 26½ years. The matron at the girl's home where Florence was seen is well acquainted with her mother, and assured us that Florence i3 the child of a full-blooded Black woman and a White soldier. She, therefore, represents the F1 generation. The parents were not available for study.
The young woman is 149.1 cm. tall and weighs 106 pounds; she is small; shows no hybrid vigor of growth. The span is 148.5 cm., and relative span is only 0.996 which is low even for a White woman, a fortiori for a Black.
The nasal breadth is 37 mm. which is slightly above the halfway between the mean nasal breadth of female Blacks and Whites. In absence of information about the father, we can not say whether there is any evidence of partial dominance of narrow nose.
The interpupillary distance is 68 mm. This is greater than the mean of Blacks, and far greater than that of Whites. There is here no evidence of dominance of the narrow interpupillary distance of the Whites, but rather the reverse. The face length — face breadth is 91.4 per cent which is above the mean of Browns, and fairly close to the mean of the Blacks. The hair is medium dense on the eyebrows, and is about 4 mm. long on the arm; which is slightly below the mode both of Blacks and Browns.
The skin color was not measured. The hair curl had a diameter of 12 mm., which is straighter than the average of Browns.
On the drawing of a man she scored 5, which is below the average of 10-year-old Black juveniles. On the geometric figures she scored 66, which is about the mode for Browns.
The consideration of these two Mulattoes is chiefly instructive as a warning against drawing final conclusions as to dominance or recessiveness from single matings, no matter with what assurance that the parents belonged to full-blooded Black and White races respectively. Among both Blacks and Whites are many biotypes; and both races carry gametically many genetic possibilities, not expressed phenotypically.
PART VII — GENERAL DISCUSSION
In any study of race crossing we look for (1) evidence of increased variability in race differential characters; (2) evidence of dominance or recessiveness; (3) appearance of new qualities; (4) evidence of hybrid vigor; (5) social traits of the hybrid.
We will take up each of these subjects in turn.
1. VARIABILITY
The internal factors that control human development are paired. One member of the pair has been derived from the egg and one from the sperm. There are excellent reasons for concluding that the principal agents in internal control are the pairs of chromosomes.
If the chromosomes of the father and the mother are alike in the genes that they carry, the offspring will be alike and like both parents. In a highly inbred population, the genie composition of all the chromosomes will be very similar or identical so that, given fairly comparable and average external conditions of development, the children will grow up in the same way, and the rising generation will be characterized by great uniformity. actually, the chromosomes of the parents usually differ in one or more genes, consequently the children will be more or less unlike. And if the parents differ in one gene only, or in one trait, then the children will differ in that one trait only and will be otherwise alike. And this will be true, even if the trait in which the parents differ is a racial trait — e.g., eye color.
If two persons of the same family stock and resembling each other, except that one has blue eyes and the other has homozygous brown eyes, should marry and retire to an uninhabited isle, and their progeny in turn should intermarry, the descendants will be wonderfully uniform, except in eye color. The fact that they carry different racial traits in respect to eye color does not introduce an orgy of general variability in somatic and mental traits. Just eye color shows marked variability.
Recently Herskovits in a series of papers (1924, 1925a, 1926b, 1927), has called attention to the low variability (or at least the absence of exceptionally high variability) in the mixed "colored" population of the United States. He finds this fact to be in conflict with expectation "that when large variation is found in a population, this means it is the result of a great amount of race crossing" (Herskovits, 1927, pp. 68, 69) and "it is held that the 'pure' population is less variable; and, therefore, from this it allows that low variability is an earnest of racial purity." Again to quote from Herskovits (p. 69): "The implicit assumption which has followed has merely carried the implication to its logical conclusion; if a racial group is marked by certain well-defined characteristics, then a population having them is not as variable as another having them, and the characteristics of another racial group with which it is mixed."
A consideration of Herskovits' papers raises the doubt if he is wholly clear on the relation of variation to heterozygotism. Two races may differ genetically in few points. In the traits in which they differ genetically variability in the second hybrid generation may be (under certain circumstances) expected; but in the traits in which they do not differ genetically increased variability is not to be expected, nor is it ordinarily found. It does not strengthen Herskovits' conclusion to show, as he does (1927, p. 75), that mixed negroes are not more variable in stature than the white U. S. troops. For, on the average, the u. s. white troops were found to differ in stature from "negro" and colored troops by only 0.2 mm. There is no reason for believing that the stature (as a "unit character") of modal Whites and modal American Negroes differ by any gene. If not, then we should not expect hybrids between them to differ from the parental stocks in variability. Herskovits concludes (1927, p. 75), "if we consider these tables, we find that the lowness of the variabilities of the mixed American Negroes is remarkable in the light of the theory that high variation goes with large amounts of racial mixture." The implication in this sentence is not sound. The proper theory is that high variation in any trait in a mixed population is usually associated with genie differences in that trait in respect to which the races are mixed.
To throw light on this problem we have listed in table 353 traits i that differ so strikingly between Whites and Blacks as to render it probable that they are genetically distinct in the two races. In this table are given the standard deviations of these traits in Blacks, Browns and Whites. In a few cases, where the mean of the trait differed greatly in the two races, the coefficient of variation is introduced in parenthesis. Both physical and mental measurements are listed.
We find that in 52 sets of measurements of such traits in the 3 groups, the variability is greater in Blacks 9 times; in Whites 13 times; and in Browns 30 times. Since the "quota" of each color group on the basis of mere chance distribution is 17.3, it appears that brown meets its quota 174 per cent. This tabulation, then, does not indicate for our Jamaican series a lack of variability in the racially mixed Browns, but, on the contrary, a very widespread excess variability in the mixed group.
Our findings in respect to variability seem, thus, not to support Herskovits, and the reason seems to be partly that he has not considered relative variabilities exclusively in those traits in which the parent-species are probably genetically distinct.
Other authors have found an unexpectedly low variability in a hybrid people, and so it will be useful to consider generally the results of studies ion variability in human mixtures. The available materials for such a study are as follows:
1. Fischer's (1913) Rehobother bastards.
2. Sullivan's (1920) Half-blood Sioux.
3. Wissler's (1924) Negro-Whites in U. S. A.
4. Rodenwaldt's (1927) Mestizos of Kisar.
5. Dunn's (1928) Hawaiian hybrids.
a. Fischer's Rehobother Bastards
These are hybrids between Boers (Dutch peasants) and Hottentots, for the most part started 100 to 150 years (or 4 or 5 generations) before they were studied by Fischer. Consequently the ancestors were not seen. Also Fischer was able to study only 8 male and 7 female Hottentots. The numbers hardly sufficed to give a picture of the Hottentot ancestry. Apparently no Boers were studied. Consequently it is impossible to say whether, or in how far, the bastards are more variable than the parental stocks. Fischer compares the standard deviation and coefficient of variation of a number (27 to 43 of each sex) of male and female bastards with respect to cephalic index, face index, nasal index, 3 face proportions, stature, relative arm length and leg length, and intermembral index. For controls he employs variability data from 100 men and 100 women of Bavaria — of which latter, he says himself, one has to feel that it is a hybrid population. Even so, the standard deviation of cephalic index for 100 Bavarians is 3.21, which is less than for Jamaican White males of our series; so that our Whites are the more variable. Our hybrid Whites in several traits show a greater variability than the white-negro hybrids.
Fischer found a standard deviation of the male nasal index of the bastards of 7.34±0.63, whilst Jamaican Brown males give a standard deviation of 9.82±0.49. The bastards have the less variable nose, probably because the contrast in nasal index between Boers and Hottentots (nasal index, 41.0 per cent) is not as extreme as between English and Gold Coast Negro (45.8 per cent).
The conclusion of the matter is that the size of the standard deviation of the bastards is not sufficient to demonstrate the view (Fischer, 1913, p. 192) that the bastards have become a constant population, even more so than the Bavarians. Nevertheless, 4 or 5 generations of natural and sexual selection have probably reduced variability from the "F2" generation, if we may speak of such when one, if not both parental stocks, was already hybrid.
b. Sullivan's Hale-blood Sioux
This clear-headed investigator tabulate (Sullivan, 1920, p. 169) the standard deviations of pure Sioux and half-bloods, and concluded (p. 170): "We can not rely wholly on the coefficient of variability as an index of homogeneity of type. When a given character is very similar for two groups the one which is racially more pure degree of variability than the one that is the more heterogeneous." This is genetic expectation. Since, by hypothesis, in the trait in question, there is no genetic difference in the trait in question, there is no reason to expect variability in this trait in the "hybrid." But Sullivan (p. 171) finds that "in a grater number of observations the distribution among the half-bloods was m more irregular" (than among full-bloods).
c. Wissler's Negro-Whites in United States
Wissler (1924, pp. 137, 138) also starts from the principles that "race crossing will also increase variability" and "that relatively high variabilities indicate the presence of two or more racial stocks." These principles are too briefly expressed. To state the truth and expectation properly and fully we should say: We expect high variation, in the later generations following the cross, only just in those traits that have a different genic constitution in the races crossed. Thus, if the two races have the same stature, dependent on the same genes then their progeny in F2 and later combinations will not beexpected to have a relatively high variability.
Wissler considers the "negro" whose measurements are reported on in "Army Anthropology" of Davenport and Love (1921). These negroes were to a considerable (though unknown) extent hybrids between Whites and full-blooded negroes. He points out that the variabilities of these "negroes" are relatively high in stature and weight, though relatively low in chest girth.
Herskovits (1927, p. 70) stresses the low variability of the chest girth of the "negro". It is, however, doubtful if the variabilities are capable of a simple racial interpretation. It is possible that the variability in height or weight of the "negro" is due to his being distributed over so wide part of the country in both urban and rural environments. The medical examiners, upon whose returns the statistics employed by Wissler are based, used different standards in different parts of the country. In the north and in cities the stature of recruits was largely taken as required by the "Regulations," without shoes, but in rural regions particularly in the south, "negroes" were apt to be measured with or without shoes as they came before the recruiting surgeon. Weight was highly variable on the same account. But probably nearly all recruits were examined with the shirt off for stethoscopic instrumentation and measured for chest circumference on the skin. Accordingly the chest girth of "negroes" is not so variable as stature and weight are. Indeed, variability of chest girth is exceptionally low in the "negro" group.
d. Rodenwaldt’s Mestizos of Kisar
Rodenwaldt's work is perhaps the most extensive on a hybrid population yet published. He devotes some pages (pp. 395-405) to variability in the Mestizos. The results may be reviewed here.
Stature — The mean stature of 39 male Kisareans is 162.3 cm., while the Dutch soldiers, probably like those soldiers that there sent to Dutch East Indies and constituted the White ancestors of the Mestizos, average 164.9; they are intermediate in stature. The coefficient of variation is 3.55 for the Mestizos, 2.31 for Bavarians, 3.96 for Kisareans, including the nobles who have immigrated from the northwestern part of the Archipelago (Marna), and 3.52 for the peasantry (Boers)—probably the Malay foundation stock for the Mestizos. The Mestizos are probably slightly more variable in stature than either foundation stock.
Pelvic breadths — anterior trunk wall — In males there is little difference between Kisareans and Mestizos in mean size or in variability. In females the coefficient of variation is 2.91 in the Kisareans and 5.85 in Mestizos. Hence variability is increased in the female hybrids.
Lower arm — upper arm — In the male this ratio is about 78.9±0.5 in the Kisareans, 77.1±0.5 in the Mestizos, and 78.4 for Bavarians. In the female the ratios are 78.7±0.2, 74.5±0.6, and 75.7 respectively. The coefficient of variation is 2.69±0.33 for the male Kisareans and 5.47± 0.29 for the male Mestizos; but the coefficients of variation do not differ significantly in the female. Similarly, the Mestizos have a strikingly large coefficient of variation in the following physical traits: minimum girth of lower arm (p. 156), males and females, the ratio of lower leg to upper leg (p. 162), foot breadth (p. 169), ankle girth (p. 170); morphologic face height (p. 186), minimum frontal breadth (p. 190), distance between inner eye angles (p. 198), interpupillary distance (p. 201), nose breadth (p. 212), nasal index (p. 214), and nasal depth nasal breadth 5 (p. 216), height of mucosa on lips (p. 230), and skin color (p. 242).
Rodenwaldt concludes (p. 403), "Mit Ausnahme der Unterschiede am Stirnskelett liegen also gesicherte Unterschiede allein vor bei distalen Merkmalen, zu denen wie die Nase .... und mit ihr die morphologische Gesichtshöhe — rechnen müssen, ausserdem bei den Farbenmerkmalen, die ebenfalls distal lokalisiert sind. Wahrscheinlich würden sich noch für weitere Merkmale dieser Art bei grösserem Material Unterschiede finden lassen."
"Gerade aber für die proximalen Koerperteile und -abschnitte und für deren wichtigste Relationen untereinander, sowie auch für die Masse des Kopfes fehlen Unterschiede gänzlich."
Rodenwaldt (p. 404) further properly calls attention to the fact that just polymeric characters rarely show the extreme ranges of variation after hybridization.
e. Dunn's Hawaiian Hybrids
This study on Hawaiian-Chinese and Hawaiian-European crosses leads to the result that "all physical characters of the kind observed are quite variable, even in pure racial groups; and this physical variability is somewhat increased in the hybrids, chiefly through the formation of different combinations of characters, although the hybrid groups can not be distinguished from the 'pure' types merely by increased variability in single traits." Although only 7 mature F2 individuals were measured, Dunn (1928, p. 163) concludes: "the second generation is more variable than the first."
The conclusion on variability in human hybrids that seems to flow from our own studies and those of others is this:
A hybrid population between races A and B does not show a higher variability in all of its characters than the parent races show. But, if the parent races are reasonably "pure," and if the samples of the parent races that are studied resemble closely the stocks that originally went into the hybrids, then in respect to just those traits in which the parental species differ genetically (especially if the traits be genetically simple) the hybrids may be expected to show greater variability than the parental races.
This high variability is found in our Browns of Jamaica in such traits as interpupillary distance, nasal breadth, ear index, skin color, diameter of hair curl. These are all marked differential characters between the White and the Black.
The fact of this high variability of these traits in the mixed group i3 excellent evidence that human traits segregate just as those of other animals and of plants do. The evidence of Mendelian inheritance in man is, indeed, so overwhelming and has been so long known that reference to it here might seem unnecessary, were it not that, occasionally, anthropologists arise who appear to be skeptical on the matter.
That the consequences of Mendelian segregation can be obscured in a mixed hybrid population by subsequent selective mating can not be denied. This result is not only theoretically to be expected, but seems to have been demonstrated by Herskovits.
2. EVIDENCE OF DOMINANCE
The conclusion that gene mutation has played an important role in human evolution follows, in part, from the proof of segregation; and this, in turn, is demonstrated by the facts of variability already set forth. Other evidence that may properly be sought for is that of dominance.
Simple dominance is not so frequent in Homo sapiens, as might be expected. This is due to the fact that many human traits, like skin color, develop under the stimulus of two or more distinct genes. It is as though Homo sapiens, through its long evolution, had accumulated many genes that affect the same organ or tissue. The dependence of so many traits on multiple factors makes the study of human heredity much more complicated than that of insects — Dresophila, for example. But because it is difficult to analyze heredity in man is no reason why the attempt should not constantly be made. The important end justifies the effort.
Also, just this study is not well adapted to an investigation of heredity; because it includes to only a slight extent family studies. For the most part, we deal with two racial stocks and a hybrid population derived from those two stocks.
Within these limitations can we find any criterion for dominance? The general formulae of the proportion of homozygotes in an inbred population (such as those of Pearl [1913, 1914] and Jennings [1912, 1914]) seem to be of limited application in our study. Close interbreeding in a mixed population tends, on the whole, to diminish the proportion of individuals that show the mono-hybrid, or simple, dominant
In case a trait depends on only one gene we expect that with inbreeding in the second generation 75 per cent of the offspring shall show the dominant trait. In 10 generations with continued inbreeding only 55 per cent of the population will be dominants. In case a trait depends on 2 genes in F2 about 94 per cent will show dominance in some degree; in the course of 5 generations of close inbreeding this proportion will diminish somewhat. But with panmixia in the hybrid population certainly for a long time the dominant, or semidominant, condition will continue to prevail in the population (cf. Pearson, 1904, p. 60). It seems a fair hypothesis, therefore, if the hybrid population is nearer to one than the other ancestral condition in any trait, that is a dominant trait, or at least that it comprises prevailingly dominant factors.
Now we have seen in the tables that the mean hybrid population of Browns is, in some respects, nearer to the Blacks; in others, to the Whites; and where these deviations from a median position are marked the conclusion is suggested that the deviation is due to dominance. Examples of such divergence of the Browns from the median position, together with the differences that are shown between them and the parental color groups, are listed in Table 354. In the following traits the Browns are close to the Blacks and significantly removed from the Whites: absolute sitting height, intercristal breadth (males), absolute span, length of total arm and of lower arm, length of hand and foot (female), interpupillary distance (males), interpupillary distance-j-head width, nasal breadth (female), pinna height, ear index (male), diameter of hair curl, pitch discrimination, time discrimination, errors in making the manikin, time in doing moron test and the drawing of a man.
Since in practically all cases of genetic difference between the races the hybrids approach closer to the Blacks than to the Whites we would reach the remarkable and improbable result that all Black mutations are dominant mutations or all White mutations are recessive.
The first general statement that can be made is that in differential traits the Browns are, in general, much closer to the Blacks than to the Whites. The reason for this may be twofold. One, there may be a partial dominance of the negro trait If so, it is remarkable that the negro traits are so nearly uniformly dominant, in the greatest variety of physical and even mental traits. A second hypothesis is that selective mating occurs, by which the Browns tend to marry Blacks and so to approach them by sex selection. This is a result that would follow if there were many more Blacks than Whites to select mates from. And such is, indeed, the case in Jamaica. Consequently, the Sambo type is much commoner in Jamaica than the Quadroon type; while, in parts of the United States (where Whites predominate), the reverse is true.
To test the second hypothesis, let us consider a series of traits measured by Herskovits (1927, pp. 74, 75; 1927a, pp. 303-312) for U. S. "negroes"; by Hrdlička (1925, pp. 131, 161, 248) for U. S. Whites; and, as controls, by Weninger (1927, pp. 29, 32, 162, 163) for West African negroes (Table 355).
From Table 355 it appears that, in respect to facial length, height of nose, length of head, cephalic index, the U. S. "negro" is closer to the "Old American" Whites than he is to most African negroes. On the other hand, the U. S. "negro" is nearer to the West African than to the "Old Americans" in ear length, sitting height, nose breadth, and stature. The significance of the finding as to the last trait is uncertain, since the stature of the negro male in the U. S. — in a larger series — is practically identical, on the average, with that of the white population.
As appears from the Table 111, the mean height of nose of the male Browns of Jamaica is only 0.13 mm. removed from that of Blacks, but 3.44 mm. removed from that of Whites. However, in the United States, the Browns ("negroes") have an average height of nose almost identical with that of Whites and far removed from the negro type. Since a trait of Browns is like that of Whites where Whites predominate, and like that of Blacks where Blacks predominate, it seems probable that closeness of a trait in the Browns to that in one of the parental races is due to repeated back-crossing to that species. We conclude, accordingly, that the frequent closeness of the Browns to the Blacks in Jamaica is a consequence of the repeated back-crossing of the hybrids to the negro stock, rather than to the White stock.
One observation is not fully in accord with this view; namely, that on skin color. The average percentage of N in skin color of full-blooded Blacks of Jamaica is 79.1. Browns in Jamaica have an N percentage of 65.7, and "negroes" of U. S. A. of 66.6 (Herskovits, 1927, p. 313). We should expect the negroes of U. S. A. to be lighter in skin color than the Browns of Jamaica; but the measurements, as given, do not support this hypothesis. Further studies are required to explain this anomaly.
The conclusion of the whole discussion in this section is that dominance can not be properly studied by noting the relation of the mean of the mixed population to one or the other allelomorphic trait, but only by family studies.
The view that the approach of a mixed population to either parental race may depend on the amount of back-crossing with the numerically dominant pure race is not quite the same as that of conscious selection of consorts approaching phaenotypically to the dominant race; a view urged "by Herskovits (1926). In some cases such conscious selection is decisive in bringing about the result But in other cases, when the trait is practically invisible, it can not be. Thus, as is shown on page 252, in palm prints the Browns approach more closely to the Blacks than to the Whites. It is quite inconceivable that any selection of consorts has been made on the basis of their palm prints; although it is thinkable that it might be made on the basis of something with which the palm-print pattern is correlated. But, wholly apart from conscious selection it is obvious that repeated mating back to one type will tend to cause the hybrid population to approach that type in many of the differential traits.
3. evidence of hybrid vigor
It is repeatedly found that when two inbred varieties are crossed the offspring show unusually rapid growth, attain exceptional size, and display other traits of rapid development, high resistance and increased fecundity, which are collectively designated hybrid vigor. This is generally regarded as due to the summation in the hybrid of two sets of dominant factors for development and vigor.
Such hybrid vigor, or heterosis, is ordinarily found in the F1 generation, but it may appear in individuals of later generations of panmixia whenever the two causative genes are combined in the same zygote. Even in later generations than the first, scattered individuals should be found who show hybrid vigor and increase the average size of the body, as a whole or its parts.
Do we find evidence of such hybrid vigor in the Browns? To focus attention on this matter we bring together a series of means relating to size in the three groups for either sex (table 356).
an examination of table 356 shows only one case where the mean of the Browns exceeds that of both Blacks and Whites by more than twice the probable error. this is the ratio of transverse chest diameter to sitting suprasternale. the difference between Blacks and Browns is 0.58 per cent and the probable error of the difference is 0.34. so this can not be considered a significant difference.
We have to conclude, consequently, that there is no evidence of physical hybrid vigor in the Browns, as contrasted with the Blacks and Whites.
4. Sexual dimorphism and its racial differences
It is well known that men and women differ in physical proportions, such as stature, breadth of hips, and so forth. it was desired to see in how many proportions they differed, and to see if such differences were found equally expressed in Whites and Blacks.
A convenient index to the difference between the sexes in any trait is the quotient of the dimension of the trait in the female divided by its dimension in the male. This female/male index has been computed for a number of physical traits. A summary of the most important of them is given in table 357.
In interpreting this table it is to be kept in mind that the nearer the index is to unity (1.000), the less is the sex dimorphism; the greater the departure from 1, the greater the dimorphism. a small ratio in any dimension indicates that the female is relatively small in that dimension, as compared with the male. a large index indicates that the female is the larger.
Among the Whites the most differential sex dimension is absolute weight, female—male index, 0.834. Other small ratios are: neck girth, 0.857; hand breadth, 0.873; absolute cranial capacity, 0.877; chest girth, 0.898.
The following are distinctly, but less generally recognized, sex-differentiating dimensions: ankle girth, 0.902; tibiale height, 0.911; length of lower arm, 0.914; absolute span, 0.914; stature minus kneeling height, 0.914; hand length, 0.918; foot length, 6.921; pinna breadth, 0.922; stature minus sitting height, 0.922; acromion — stylion, 0.924; upper arm length, 0.924; nasal breadth, 0.925; stature, 0.928; and intercristal breadth, 0.928.
The following dimensions and ratios are larger in the female than the male. Intercristal breadth — biacromion breadth, 1.053; cephalic index, 1.010; head height — head length, 1.007; upper arm — lower arm, 1.006; relative kneeling height, 1.003.
If, now, one examines the female/male ratios of the Blacks, they do not always run precisely parallel to those of the Whites, but, in general, the same traits are sexually dimorphic in the two races. In the Blacks the greatest difference between the sexes is in absolute weight, 0.814; a difference more marked than in the case of Whites. Other very low indices of Blacks are: cranial capacity calculated by means of the white formula, 0.880; neck girth, 0.881; nasal breadth, 0.889; nasal index, 0.897.
Still other low black female/male indices are: chest girth, 0.907; hand breadth, 0.910; lower arm, 0.915; cranial capacity, calculated by the negro formula, 0.916; absolute span, 0.918; upper arm length, 0.918; foot length, 0.920; stature minus sitting height, 0.922; tibiale height, 0.922; hand length, 0.925; acromion — stylion, 0.928; and stature, 0.928.
The following indices are larger in the Black female than the male : intercristal breadth ~ biacromion breadth, 1.102; intercristal breadth, 1.027; relative chest girth (body build), 1.021; foot index, 1.017; minimum frontal — head breadth, 1.007; nose height, 1.006; head height — head length, 1.005. In most of the above the corresponding index is smaller in the Whites. This is true of intercristal breadth — biacromion breadth, intercristal breath, relative chest girth, foot index, minimum frontal — head breadth, nose height. The differences in these ratios between the two sexes is, in some cases at least, a marked racial differential.
Among the Browns, in general, the female/male ratio, when it differs significantly between the sexes, is intermediate. But this is not always the case. The following cases, where the ratio of the Brown is less or more extreme than in either White or Black, are probably significant The sexes are more alike in: stature, weight, absolute sitting height, chest girth, tibiale height, foot length, foot index. The sexes are more unlike in: relative sitting height, lower arm — upper arm, minimum frontal — head breadth, face length — face breadth, upper arm — lower arm.
There is material for speculation in these facts. What has made sex-differentiation among Whites so great in chest girth, tibiale height, foot length? Why is the face of the Black woman relatively so much narrower compared with the male, than in the case of the Whites. We have probably, to do with genetic, sex-associated factors that differ in the two races. The female/male ratio deserves more widespread consideration than has yet been given to it Dunn (1928, pp. 106, 108, etc.) has computed the ratio in a few instances. The ratio gives a fine insight into sex-differentials in the various races of mankind.
5. mutations in man
Three-quarters of a century ago there was a warm controversy among anthropologists on the topic: "Is man a single species?" To-day, thanks largely to the discoveries of modern genetics, that question has no meaning. We know now that no "species," or biotype, stays constant for a long period of time. Mutations are constantly occurring, and some of them may, under favorable conditions of mating and breeding, come to be the heritage of a considerable population. The definitive criterion of genetic distinctness of a trait is, of course, its behavior in breeding. But, also, if two populations show, on the average, a difference in a trait that (in a large series) is many times greater than the probable error, then the hypothesis may be entertained that that difference has a genetic basis. Of course, this does not apply to traits already known to be very responsive to any such differences of environment that two populations may be experiencing. But the vast amount of genetic change that mankind is undergoing warrants us in suspecting a genetic basis for a large difference for, which there is no obvious environmental cause.
Of course, many small individual differences have primarily a genetic basis, but they are not so readily detected as the larger ones. Such small differences are found in the papillary patterns of the fingers, peculiarities in size and form of individual teeth, differences in proportional length of the phalanges of corresponding fingers. Every family, especially every inbred community, contains many mutations that have arisen within a score of generations. If endogamy continues for a few generations, some of these mutations may become so widespread as to make of this community a distinct biotype.
Now the negroes of the West Coast of Africa constituted, before Europeans entered their territory, a population in which had heaped up many mutations that differentiated them from North Europeans or from Amerindians. These mutations were imported with the slaves to America, where they still perpetuate themselves.
Our study has revealed a number of genetic differences between negroes and Europeans. But those that we have studied are only a fraction of all the differences there are between these populations. No doubt, some day, further and more detailed morphological and functional studies will be made that will reveal many more mutations.
It would be interesting, and not impossible of achievement, to work out the mutations that the unhybridized Negroes of Jamaica have acquired during the 4 to 8 generations that they have been separated from West Africa. If we have not detected them, it is because we know less about the West African Negroes than we do about their descendants in America. The next step is to make a thorough study of the African negro in Africa to note the differences that may already have arisen and been preserved between the two widely separated branches of the negro race.
6. DO THE RACES DIFFER IN MENTAL CAPACITY?
There are anthropologists who doubt if there is satisfactory evidence that the main races of mankind differ in innate capacity for mental operations. They recognize the differences in achievement of different peoples, but point out that these differences may be due merely to differences in traditional endowment, and in training and education from birth on. Rodenwaldt (1927, p. 417) expresses himself cautiously as follows: "Ich kann mich denjenigen nicht anschliessen, die verneinen, dass irgendwelche heute noch in kindlichem Zustand verharrenden Teile der Menschheit potentielle Entwicklungsmöglichkeiten in sich tragen." While we, also, would not deny the possibility for further development of primitive peoples, especially by additions to tradition and by early intensive culture, that does not state that we agree that all such primitive peoples have the same "native endowment." Certainly races of mankind differ in physical proportions, just as dogs do; and just as dogs differ in their instincts and capacity to take advantage of special training, so it would not be strange if humans differ in these respects.
It seems to us that our psychological tests do indicate a superiority of the negroes over the North Europeans in sensory equipment, or, at least, in ability to make sensory discriminations, especially in music.
But in cases where some ability to put through a planned composition (like the drawing of a man) is required, or to put 2 and 2 together to make 4, or, rather, to put 5 pieces of wood together to make a figure of a man, the Blacks fall far below the Whites. In this case the training of the two groups has been as like as possible. Inferiority of the Blacks also showed in the ability to solve correctly the problem of the notch in the folded paper. In the ability to organize and put through the simple form-board test of Knox the Blacks are much inferior to the Whites. This form-board test does bear on ability to visualize, to plan on the basis of the mental picture, and to profit by experience. Any one who has watched the feeble-minded child with the form board is amazed at the movements he makes. He takes up a piece to fill a hole only half as large as the piece. The onlooker thinks he ought to see that the piece won't fit But that is the trouble: he does not see mentally; he does not carry an image of the hole to match with the size or shape of the piece of wood that he is looking at So he tries the piece and first learns by superposition that it does not fit, and so rejects it But in ten seconds he may again take up the piece and try to fit it in the hole that can not receive it. He fails to profit by experience. The person who fails on, or is slow with, the form-board test is poor at planning, carries mental pictures poorly, and profits little by experience... There is reason for concluding that the Blacks are characterized, on the average, by a lower grade of capacity in these mental functions than are the Whites. Similarly the Blacks seemed inferior to the Whites in ability to criticize absurd statements and to make such practical judgments as are called for in Army Alpha Jest No. 3.
On the other hand, the Blacks seem to do better in simple mental arithmetic and with numerical series than the Whites. They also follow better complicated directions for doing things. It seems a plausible hypothesis, for which there is considerable support, that the more complicated a brain, the more numerous its "association fibers," the less satisfactorily it performs the simple numerical problems which a calculating machine does so quickly and accurately.
It seems to us the outcome of the present studies is so clear as to warrant the conclusion that they put the burden of proof on the shoulders of those who would deny fundamental differences, on the average, in the mental capacities of Gold Coast negroes and Europeans.
7. COMPARISON OF MENTAL TRAITS OF BLACKS, BROWNS AND WHITES
Is there any ground for the alleged inferiority of Browns to Blacks? It is frequently stated that hybrids are inferior to either parental stock, that they inherit the worst traits of both. Specifically complaint is often made that "the mulatto" is unstable and unreliable. See, for example, L. Agassiz, in his "Voyage to Brazil"; also Nietzsche, ["In dem neuen Geschlecht, das gleichsam verschiedene Masse und Werte ins Blut vererbt bekommt, ist alles Unruhe, Störung, Zweifel, Versuch."] quoted by Rodenwaldt (1927, p. 415). The Brown is contrasted unfavorably with the Black who, though he may be stupid and lazy, can at least be depended upon to react in his own way.
On the other hand, one hears that the mulatto is superior in intelligence to the negroes, that some of them are persons of great capacity for leadership and with more than the average white man's mentality. Among them are doctors of philosophy, university professors, poets, litterateurs, men of science. Does our material throw any light on the relative capacity of the negro and the hybrid to play a part in carrying forward the white man's civilization?
The view that hybridization sometimes produces disharmony has often been expressed. One of the present authors (Davenport, 1917) discussed this view at some length, and concluded that there is evidence of physical, mental and instinct disharmonies in hybrids.
The view was stressed by Mjöen (1923, p. 51) at the Eugenics Congress in New York City. He has found half-breeds between Lapps, and Norwegian Nordics who are sometimes "superior as regards stature to both progenitors and as regards mental powers to the Lapps among whom they are living." But he also found 9 cases of half-breeds who were wanting in balance, given to stealing, lying, drinking. In one case out of 11 children in one family 6 have poor mental abilities and 5 are complete idiots. This last case is not very convincing since feeble-mindedness is so widespread a condition, especially in inbred communities. Mjöen also exhibits photographs of hybrid rabbits with one upright and one pendant ear as an extreme case of disharmony due to crossing rabbits of different-sized ears. But Castle (1924, p. 364) asserts, as a result of long experience in breeding rabbits, that one lop-ear "is a feature not confined to crossbreeds, but of frequent occurrence among rabbits of large size, irrespective of race." "The purest races of large rabbits, such as Flemish Giants and pure-bred lop-eared rabbits, often show this asymmetrical ear carriage." It must, however, be said that Castle here offers no detailed insight into this curious and conspicuous asymmetry in ear attitude of some — even pure-bred—rabbits. It is no "explanation" to say it is frequently so. Mjöen offered an explanation — but this explanation was probably not correct.
Castle indeed "doubts" the occurrence of misfits in the first or second hybrid generation. "There is," he says, "a remarkable constancy in the degree of correlation between part and part within the body, quite irrespective of size. The genetic agencies which control the size of particular parts are identical with the agencies which control the size of the body as a whole." "I doubt whether there are any race combinations which are so far as biological qualities are concerned, inherently, either harmonic or disharmonic, that is productive of better or worse genetic combinations."
There are facts in hybrids that do indicate that they may show disharmonious combinations of physical traits. Thus long arms and legs are closely correlated in the males. Yet in hybrid individuals this correlation may show itself weak.
Thus of 3 Brown women with a relative span of 98 or 99 (an exceptionally low ratio for negroes, and not common among adult Whites) 2 (U. B. and M. A. L.) have a relative sitting height of 52 or 53 per cent (only mediocre for Browns). Span (2 X arm length + shoulder breadth) and sitting height (approximately, stature minus leg length) are indeed rather closely correlated, on the average, but these 2 individuals have very short arms and medium long legs. Again, a Brown female (S. M.) with a relative span of over 110 has a relative sitting height of 52 or 53 per cent, just like the women with a relative span of 98-99. The average of such cases will give span associated with mediocre sitting height. But this harmonious mean is made up of some very disharmonious individuals. We do not know whether the disharmony of long arms and short legs is a disadvantageous one for the individuals under consideration. A long-legged, short-armed person has, indeed, to stoop more to pick up a thing on the ground than one with the opposite combination of disharmony in the appendages. The point is that even so closely correlated traits as these are inherited, to a certain extent, independently.
Disharmonies in the mental sphere are socially more significant, perhaps, than those in the physical sphere, and such disharmonies are apparently common in the adult Browns (see Table 358). Such disharmony and confusion apparently appear in visualization and reproduction, as in putting together the parts of the manikin. The proportion of failures of the Browns is 9.6 per cent, as opposed to 3.1 per cent in Blacks and 2.1 per cent in Whites. In copying of geometric figures 5 per cent of Browns) fail completely, as compared with 3 per cent of the Blacks and 0 per cent of the Whites. In the Army Alpha Test IV (opposites and similars) j 41 per cent of Browns-got only 3.7 or fewer correct, while only 23 per cent of Blacks did so poorly and none of the Whites. In Test V (pied sentences) 30 per cent of the Browns got fewer than 3 out of 24 questions right, while only 26 per cent of the Blacks and 13 per cent of the Whites did. In Test VII (of analogies) 45 per cent of the Browns got less than 10 per cent of the questions correct, while only 30 per cent of the Blacks and 21 per cent of the Whites did so badly. One gains the general impression that, though on the average the Browns did not do so badly, there was among them a greater number of persons than in either Blacks or Whites, who were muddled and wuzzle-headed. The Blacks may have low intelligence, but they generally can use what they have in fairly effective fashion; but among the Browns there appear to be an extra 5 per cent who seem not to be able to utilize their native endowment. There are so many variables, however, and the numbers are so small, that the results merely propose an hypothesis and do not warrant a conclusion.
The question arises: are there any traits in which, on the average, the adult Browns are superior to the Whites? We might, theoretically, expect such, yet when we have tested all of the probably genetically distinct traits between Blacks and Whites, we find only one in which the mean of the adult Browns is clearly higher than that of either parental stock.
On the other hand, if we examine the means for children of 10 to 13 or 13 to 16 years there are a few in which the brown children grade higher than either the black or the white children. These are listed in table 359. The fact that youthful Browns sometimes score higher than youthful Blacks or Whites suggests the conclusion that brown children develop in some mental capacities precociously; and then fall behind in development. The brightness of "negro" school children in the states has often been commented on. Here we see in our table evidence of the reality of this phenomenon. The great social difficulty with the mulatto is that so often, and on the average, he fails to progress far beyond the adolescent stage.
8. SUMMARY OF CONCLUSIONS
The project was carried out of studying in some detail, and comparatively, 100 each of adults of full-blooded Negroes (Blacks), Europeans (Whites), and hybrids between them, of all degrees (Browns). Half of the hundred were to be of each sex. The site of the study was to be at Jamaica, B. W. I. The three racial or color groups were to be selected from about the same social status. This ruled out the families of white officials of Kingston.
The main project was carried out as planned, and, in addition to the maim project, some 1200 children of school and preschool age were observed and measured.
The studies made may be grouped under the headings: anthropometric, physiologic, psychologic, developmental and familial.
1. Anthropometric — detailed, comparative measurements have been made on general body size, trunk, appendages, head and facial features. The three groups do not differ greatly in stature and weight; but the great size of the Cayman islanders has raised the average stature of the Whites 2 cm. above that of the Blacks. The Blacks are slightly the heaviest, despite the fact that the chest girth, absolute and relative, is not greater than that of the Whites. The question is raised whether the skeleton of the Blacks is perhaps heavier than that of Whites.
The trunk is relatively short in the Blacks, but relatively broad and stocky. The shape of the female trunk in the Blacks is absolutely broader than in the male; while in Whites it is only relatively broader. In relation to shoulder breadth the intercristal breadth is narrower in the Blacks of both sexes than in the Whites. Thus, while the Negro male has a narrow pelvis, he has a great shoulder breadth. The white torso tends more toward the form of a flattened cylinder, and the black torso more toward an inverted cone.
The Whites have longer and slenderer necks than the Blacks.
The arms of the Blacks are longer than those of the Whites whether measured directly or by the span. Indeed the large span/stature ratio is a marked characteristic of the Negro race. The arm is differently divided in Blacks and Whites. It is as if the elbow was more proximal in the Blacks than in the Whites. The hand is longer and slenderer in the Negro than the White.
The leg of the Blacks is much longer than that of the Whites. It is divided into proximal and distal segments and, like the arm, at a plane located proximally to the plane of division in the white. The foot is longer in the black than the white is, and probably slightly broader.
The head height and breadth are apparently the same for Blacks and Whites, but the Blacks have much the longer head and, accordingly, the larger cranial capacity, as computed by a formula that is based on external measurements.
The interpupillary distance is markedly greater in the Blacks than Whites, and a gene difference is probably involved, since the Browns are very variable in this respect. Also the interpupillary distance is large in relation to the head breadth.
Of the facial features that of the nose seems especially to differentiate the races. The nose of the Blacks is one-third broader than that of the Whites. The Browns are very variable; thus, we conclude that one or more genes are involved in this difference in nose form. The nose height is less in the black, and so the nasal index is much (over 1/3) greater in Blacks than in Whites.
The external ear (pinna) is shorter and, if anything, a trifle wider in Blacks than Whites. Consequently the ear index shows a much rounder ear, by as much as 10 per cent. The pinna of the black is somewhat smaller than that of the white in the male, but not in the female.
Tooth decay progresses rapidly with age, as in the united states. Up to 16 years of age the teeth of the Blacks show less decay than those of the Whites, but after that age decay rapidly. The Browns studied by us showed the best teeth of the three groups after 20 years of age.
The papillary patterns of the fingers are markedly different in Blacks and Whites. Thus, in males, Blacks have whorls in 32 per cent of the fingers, while Whites have them in 23 per cent. Radial loops, the rarest type, were found in 1.8 per cent of the fingers of Blacks and 9.7 per cent of those of our Whites. The high proportion of whorls in Blacks is the more striking since their fingers are comparatively slender. The condition in Browns is usually intermediate. The unexampled high rate of radial loops in our Whites is due to our inclusion of Seaford Town Whites, who show 5 times the rate of radial loops of the Cayman islanders.
The palm patterns show a difference between the two races, such as had been previously pointed out by wilder. The Browns approximate the negroes more nearly than they do the Whites.
The eye color is more variable in Whites than in the colored groups, since the dominant brown pigment of the latter rules. Among our Whites less pigment is shown by the females than the males; while among English and Swedes less pigment is shown by the male eye. Different mutative conditions seem to rule in different biotypes.
Skin color was measured by the color top. The Browns show much the highest variability of the three groups. In hair color, as in eye color, the Whites of Jamaica are the most variable of the three color groups. The diameter of hair curl was measured in many individuals of each color group. The coefficient of variation is greatest for the Browns, indicating segregation.
A study of hair on arms and hands revealed, quantitatively, the relative glabrousness of the Black and (to a less extent) of the Browns, while the females are more glabrous than the males.
Tongue furrows were looked for and found in one-sixth of the male Blacks and Browns, and four-sixths of the Whites.
Considering the bite, the Whites show more overhang of the upper jaw than do the Blacks.
2. Physiologic — Hand grip was found to be stronger in Blacks than Whites. The Browns were very variable. Many Browns made a very poor record, but also the strongest grip of our series was found in a Brown man.
Laxness of the wrist joint was measured and found to be greater in the Whites. This result is perhaps due to the fact that they did not labor so heavily as the Blacks examined.
The blood-groups were taken of 147 Jamaicans, and were reported on by dr. Snyder. He finds that the Blacks in the new environment still carry proof of their African relationships.
The basal metabolism records were reported on by Dr. Francis G. Benedict. He concludes that natives of the tropics have a metabolism not essentially different from that of Whites in the more northern latitudes.
Several correlations are set forth. The most striking is the high correlation between skin color and nose index. This suggests a possible linkage in inheritance which deserves further study.
3. Psychologic — The psychological tests are of especial interest, since they seem not to have been carried out on primitive peoples with Europeans as controls. Both of our groups spoke the same language, and both were living at the same medium to low economic level.
The seashore test for musical capacity yielded important results. in most tests of adults the Blacks showed themselves superior to the Whites — most strikingly in capacity for discriminating intensity and rhythm, but also pitch and time. In respect to harmony and tonal memory there was no certain difference between the groups. The sense of intensity came to be superior in the Blacks only after adolescence, but their superiority in rhythm appears at 10-13 years. Browns are usually intermediate in musical capacity. They show no striking variability over the parental races. The west India band, a select group, showed a superiority over Blacks in general, in time and rhythm.
Ability to discriminate slight differences of form was tested with plane figures. In the circles the Blacks did best in preadult ages. This result is possibly due to jess of astigmatism in the Blacks than the Whites. The adults did less well than adolescents in this test.
In the copying of geometric figures the Whites, at all ages, especially the adult Whites, are much superior to the colored groups.
In the drawing of a man, without a copy, the Whites did best and the Blacks most poorly.
In the reconstruction of a manikin the Whites finished in much the shortest time of all groups and made the fewest errors.
The nature of the figure that would result from opening out a notched paper was understood best by adolescent and adult Whites. But in the juvenile series the Blacks and Browns were superior to the Whites — an indication of juvenile precocity of the negro race.
The form-board test (Knox moron) was passed most easily by the Whites. The Blacks made the greatest improvement on the second trial.
In the substitution test, of Woodworth and Wells, the Whites were about 1/3 speedier than the colored groups, and they made fewer errors. As in the manikin test, the Whites were markedly the most swift and accurate.
In the cube imitation test the Whites scored highest and the Blacks lowest. The Browns show an exceptionally large befuddled class.
In the repetition of 7 figures, a not inconsiderable feat of memory, the Browns are clearly superior at all ages.
In the criticism of absurd sentences the Whites are clearly best of the adults; but they are surpassed by the Browns in the younger series.
In the Army Alpha test the Whites stand first in: III, common sense; IV, synonyms and antonyms; V, restoring pied sentences; and VIII, general information. They stand lowest in: I, following directions; II, arithmetic; and VII, analogies. They stand second in: VI, continuing the number series. The Blacks stand first in: I, following directions; II, arithmetic; VI, continuing the number series; and VII, seeing analogies. The Blacks stand lowest in nothing. The Browns stand lowest in: III, common sense; IV, synonyms and antonyms; V, restoring pied sentences; VI, continuing the number series; and VIII, information. But not all of these differences are significant.
The possibility of a correlation between grades of rhythm and capacity for drawing geometric figures was considered. The result of the study was to show no correlation.
An attempt was made to use the opinions of several teachers concerning the social traits of a number of MicoCollege men, Black and Brown. There were graded 23 Browns and 5 Blacks by 2 or 3 teachers each. The Blacks appear to be regarded, on the average, as less fastidious, less energetic, less popular, more impartial, more easily embarrassed when facing a group, and less distinct in speech than the Browns. There seems to be no clear difference in athletic ability between Blacks and Browns.
4. Developmental — Some 1465 young children were measured and their development studied, making comparisons between Blacks, Browns and Whites. It emerges that the long appendages of Blacks are a genetical trait that shows itself soon after birth and is probably prenatal. The hypothesis that the long-legged condition is merely a persistence to the adult of the 12-year-old condition of the White boy seems definitely negatived.
When a short-trunked race is crossed with a long-trunked race the hybrids are intermediate in length of trunk.
At birth, Black babies are not so heavy as Brown. The small size of Black babies is associated with relative ease of childbirth in negro women. Variations in the developmental curve during the first year of life are associated with tooth cutting and weaning.
The head of the newborn negro is smaller than that of the newborn White. No evidence was secured to test the hypothesis of disharmony between size of head of child and pelvic opening when the mother is a negress and the child of a mulatto.
Dr. A. Gesell finds that the motor performance of the 25 colored infants, 12-13 months of age, is like those of the New Haven White children; the standing is, if anything, better than the average 12 months White child. The language performance is near the 12-months level.
Adaptive behavior is below the White standard. Inhibition of bowel and bladder evacuation are conspicuously below the White standard.
5. Familial — Studies were made on 3 families: 1 White and 2 Brown; 2 pairs of sibs were examined in great detail, and the striking similarity in the measurements of 3 pairs of identical twins described. Two F1 mulattoes did not yield valuable data on dominance, or recessiveness, since their parents were unknown.
Variability of Browns, as compared with Blacks and Whites, is discussed generally. It appears that in those traits in which the Whites and Blacks differ genetically, the Browns are, in general, especially variable. But this result is obscured by back-mating of mulattoes to Blacks; also, as in Herskovits' case, by mate selection inside of the Brown group.
Dominance can not properly be detected by noting the relation of the mean of the mixed population to that of the parental stocks; but only by family studies.
No evidence of hybrid vigor is found in the Browns.
Sexual dimorphism is considered generally and the female — male ratios tabulated for many traits. The sex-differentials of the Whites and the Blacks are not always the same or expressed in the same degree.
Despite the frequency of human mutations, the Blacks of Jamaica still resemble those of the West Coast of Africa in many respects, They differ in others, however. This difference may be due to new mutations or to our ignorance of the African source of Jamaican negroes.
It is concluded that in view of the differences here found the burden of proof is placed on those who deny fundamental differences in mental capacity between Gold Coast Negroes and Europeans.
While, on the average, the Browns are intermediate in proportions and mental capacities between Whites and Blacks, and although some of the Browns are equal to the best of the Blacks in one or more traits still among the Browns, there appear to be an excessive per cent over random expectation who seem not to be able to utilize their native endowment.
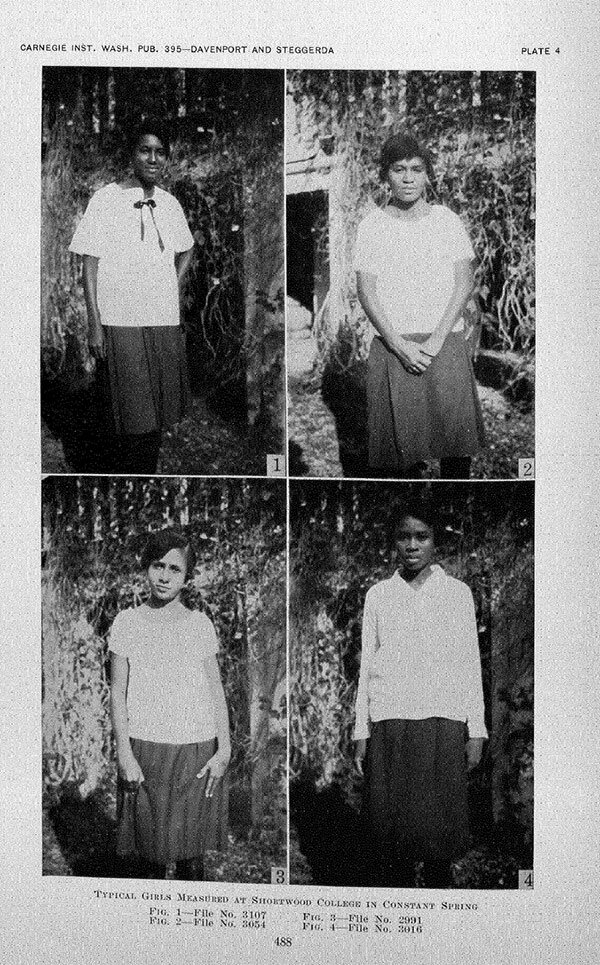
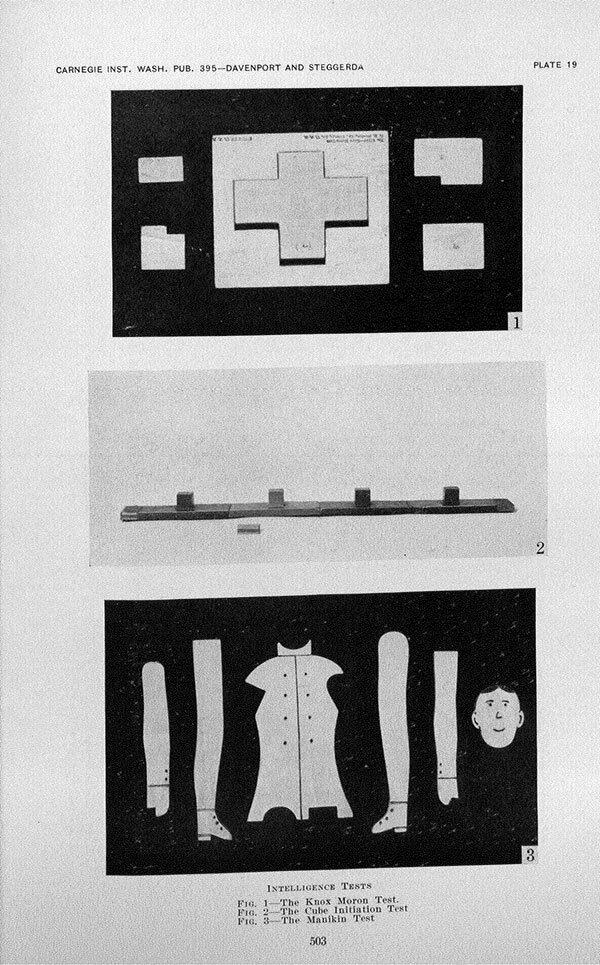
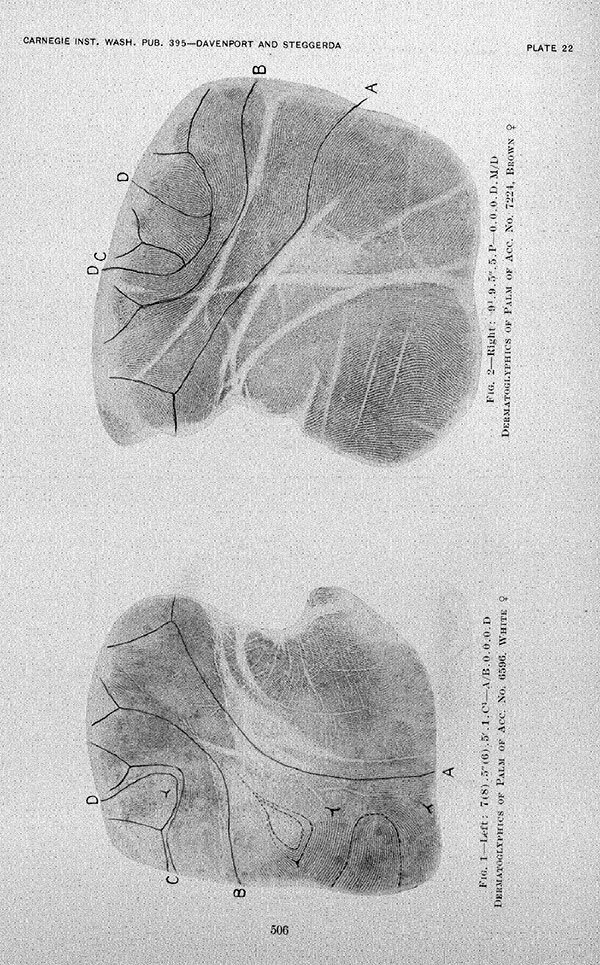
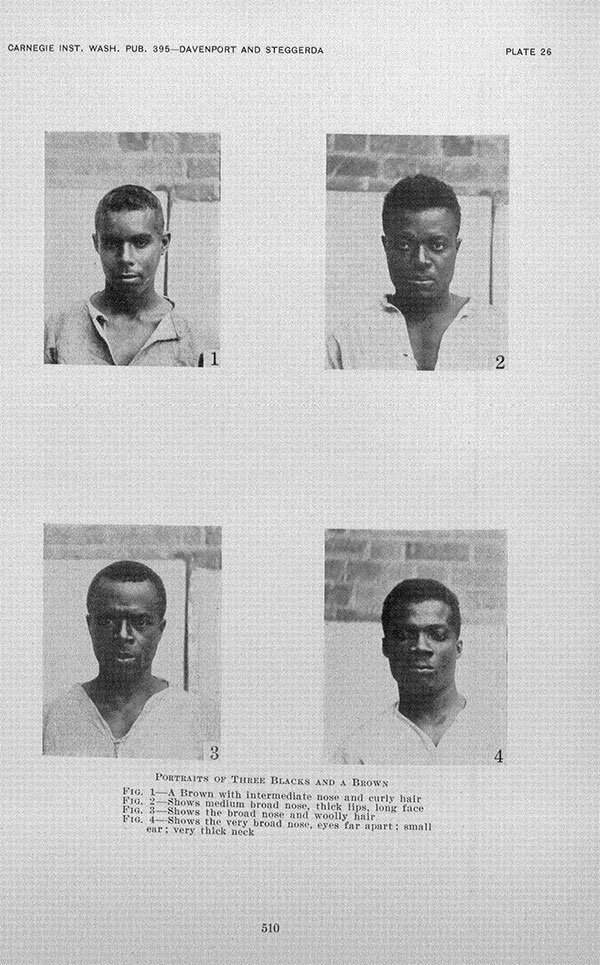
![]()
![]() Die Meinung des Seiteninhabers stimmt nicht immer mit der Meinung des Autors überein!
Die Meinung des Seiteninhabers stimmt nicht immer mit der Meinung des Autors überein!